S-Trader Desktop
S-Trader Desktop
  • Charting
    • Introduction


      • Charting Engine Overview
      • Chart Types
      • Chart Time Frames
      • Symbol Management
    • Core Features


      • Annotations & Tools
      • Built-in Studies
      • Custom Studies
      • SVA Studies
      • Expert Advisers
    • Advanced Features


      • Loop System Steps
      • Chart Trading Panel
      • Consensus Reports
    • Working With Charts


      • Chart Settings
      • Chart Templates
      • Chart Management
  • Quant Script
    • Overview


      • At A Glance
      • Primitives
      • Built-in Studies
      • SVA Studies
    • Core Features


      • Code Editor
      • Code Wizard
    • Basic Applications


      • Custom Studies
      • Expert Advisers
      • Consensus Reports
    • Advanced Applications


      • Scripted Alerts
      • Loop Systems
      • Portfolio Systems
  • Full Modules
    • Trading Modules


      • At A Glance
      • Quote List Module
      • Scripted Alerts
      • Loop Systems
    • Relative Strength Modules


      • At A Glance
      • Portfolio Systems
      • Relative Rotation Graphs
    • Auxiliary Models


      • Trade Panel
      • Event Scheduler
      • Premium News
      • Status Panel
    • Platform Tools


      • Organizer
      • Back-Up and Restore
  • Data Feeds
    • Introduction


      • At A Glance
      • Data Feed Comparison
    • Local Data


      • Supported Formats
      • Data Templates
      • Local Data Utility
    • The Instrument Panel


      • Live Data
      • Local Data
      • Downloaded Data
      • Symbol Search
      • Composite Symbols
    • Symbol Utilities


      • XL to XML Symbol Utility
      • IB Symbol Search
  • Order Routing
    • Introduction


      • At A Glance
      • Broker Manager
    • Order Types


      • Available Order Types
      • Auto-Trading
    • Cross-feed Order Routing


      • At A Glance
      • Symbol Pegging
    • Managing Orders


      • From Charts
      • From Order Dialog
      • From Blotter
  • Portfolio Management
    • Desktop Platform


      • Master Account Link
      • Group Order Routing
  • Get Started
    • New to S-Trader ?


      • Software Installation Guide
      • Video Tutorials
    • Licensing


      • Licensing Options
      • Volume Licensing
    • For Individuals


      • S-Trader Community
    • For Institutions


      • Enterprise Solution
      • Fintech Development
×
Search Results

Matrix-driven portfolio selection.

Assess relative strength patterns based on any property, formula, criteria or algorithm. Determine cumulative relative strength curves within any given investment universe. Create objective inclusion / exclusion criteria for portfolio constituents based on statistical analysis of individual relative strength numbers.

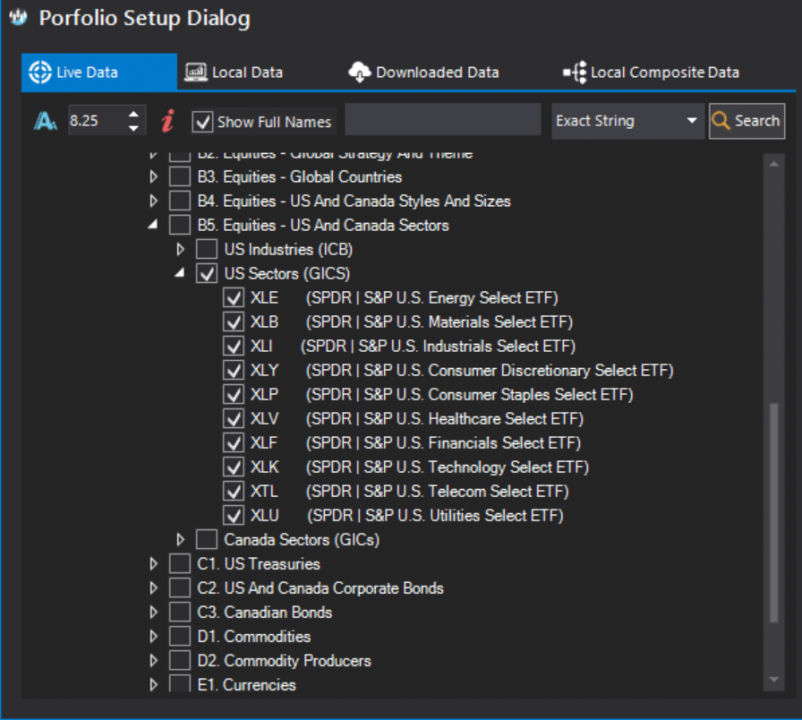
Analyze any portfolio or universe of investments. Easily include markets and instruments by simply clicking them in the Instrument Panel. You can use all the available live, local and downloaded data.

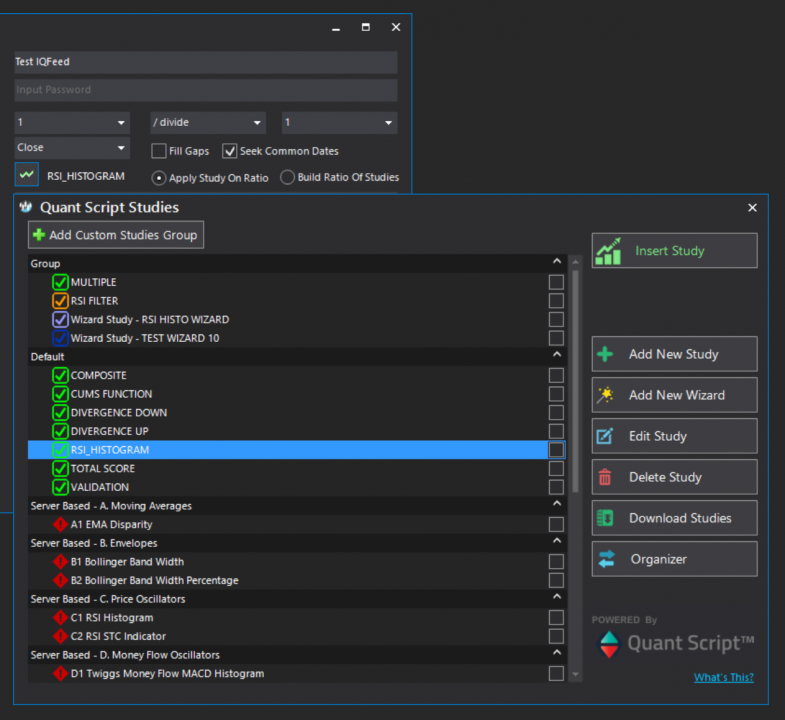
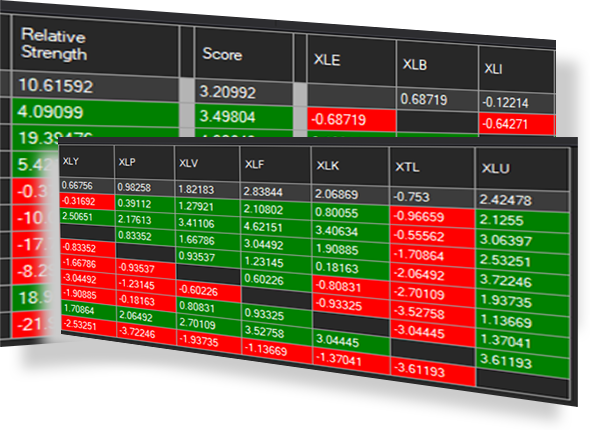
Build data composites (i.e. relative strength lines) involving any basic mathematical operation on one or multiple data fields (open, high, low, close). Compute the matrix based on any previously defined property / custom study. Build matrix results by applying such custom studies to ratios between two different instruments; or by building ratios of custom studies applied to two different instruments.

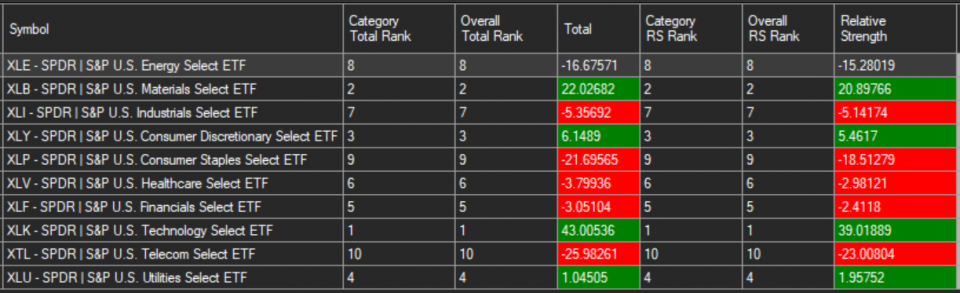
Get total relative strength points as well as peer and group rankings for all portfolio constituents. Model relative strength curves and rankings using any built-in function or any custom study to objectively determine portfolio weights.

Azoom | Responsive Wordpress Theme

All content on this website is copyright protected material of S-Trader.com and its partners

Quick Links


  • Privacy Policy
  • Legal – Please read carefully
  • Snapshot Gallery

Partners & Affiliates


  • Affiliates Sign-Up
  • Affiliate login
  • Fintech Development
© Copyright www.s-trader.com, 2004-2018