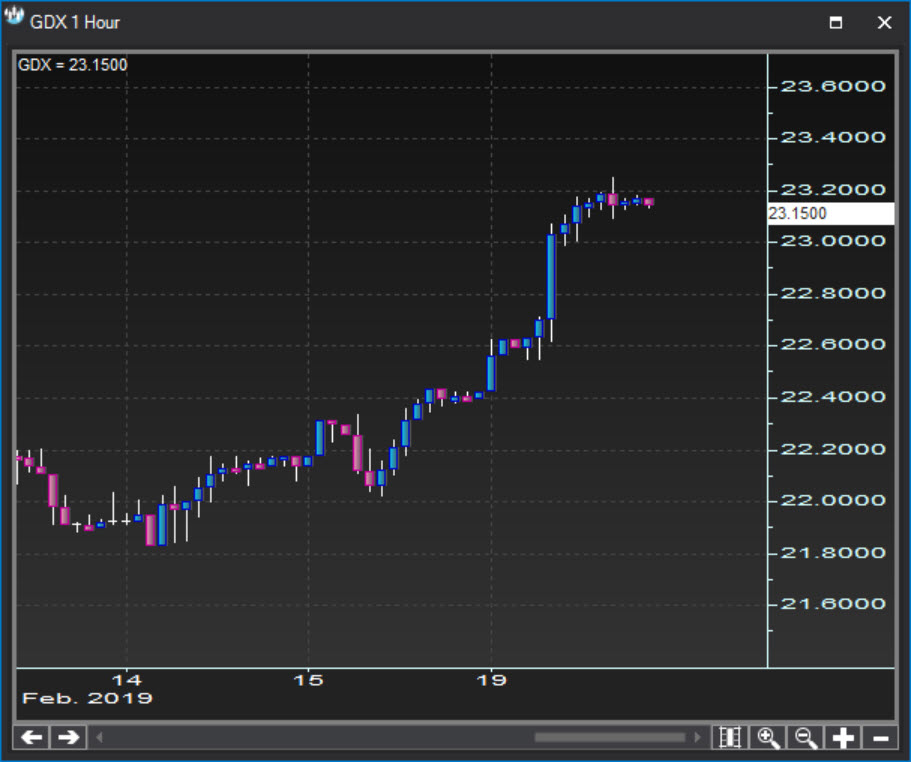
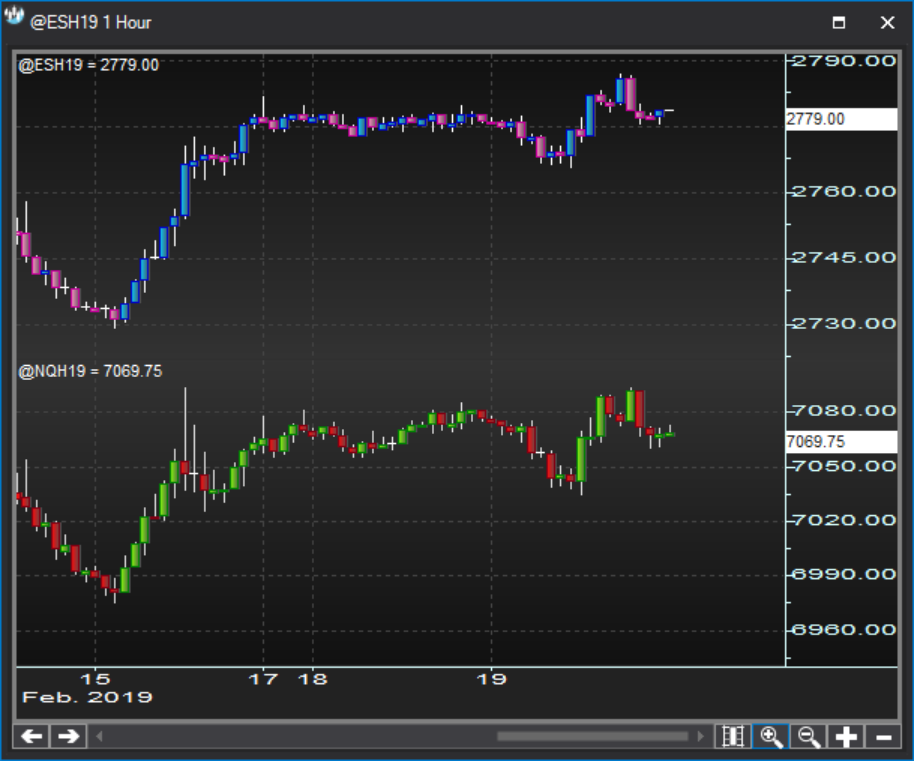
Single & composite symbols.
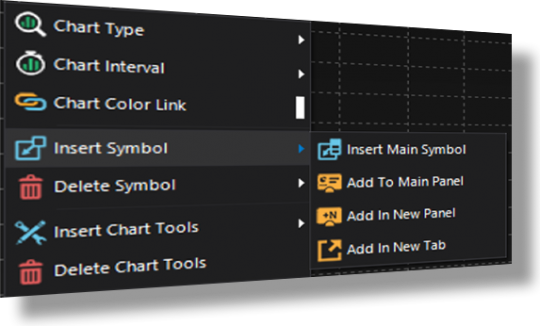
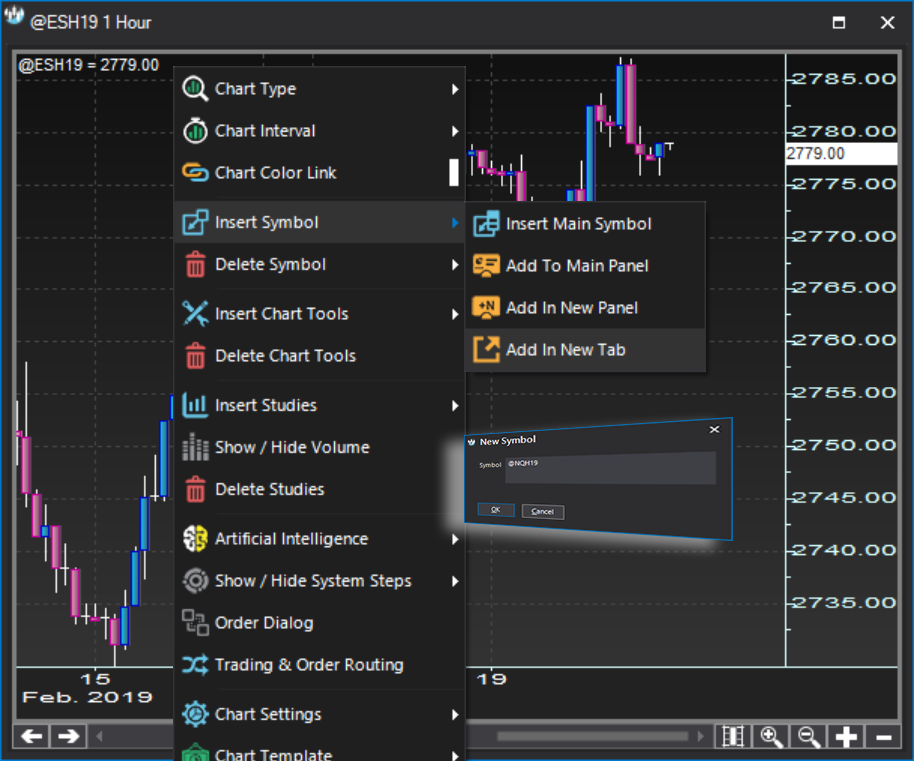
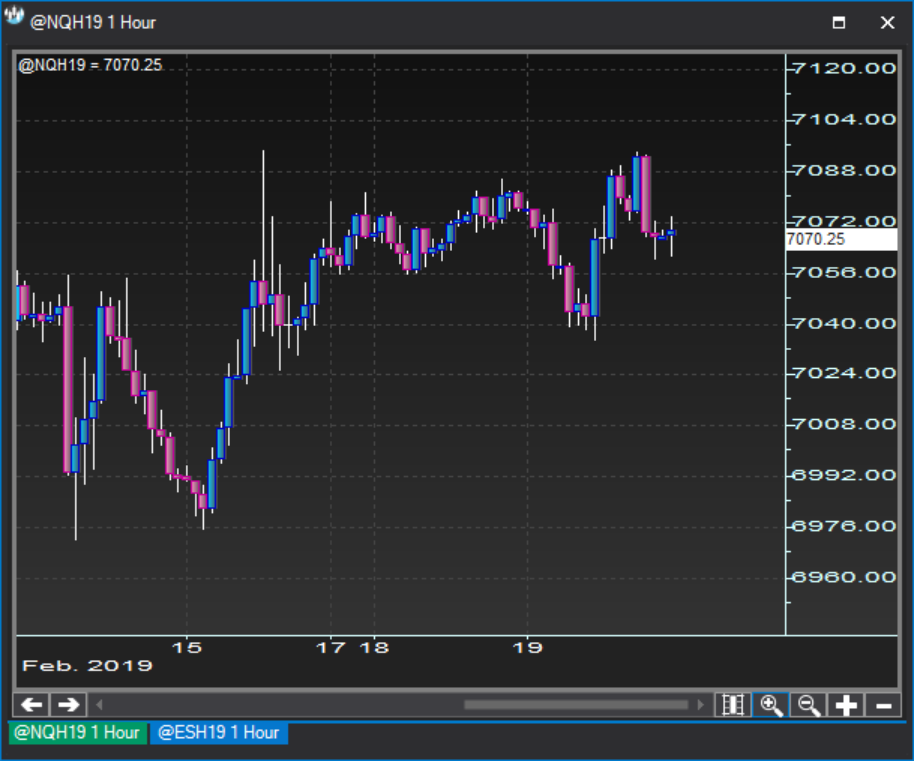
Plot single or composite symbols in the same panel, on the same chart or on different tabs.
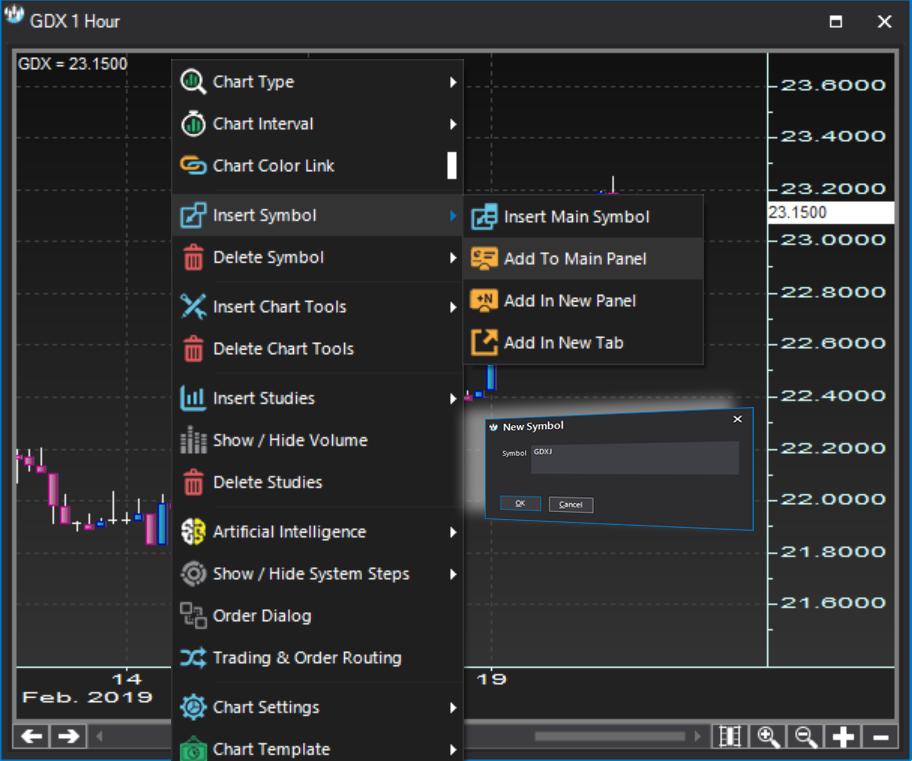
Main Panel
Same Panel
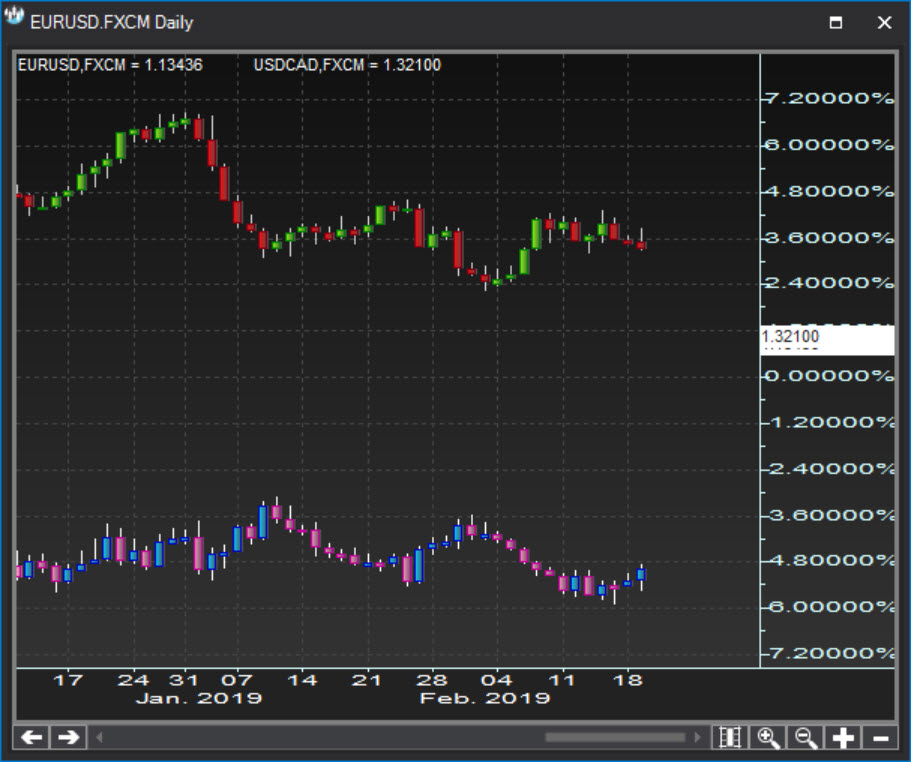
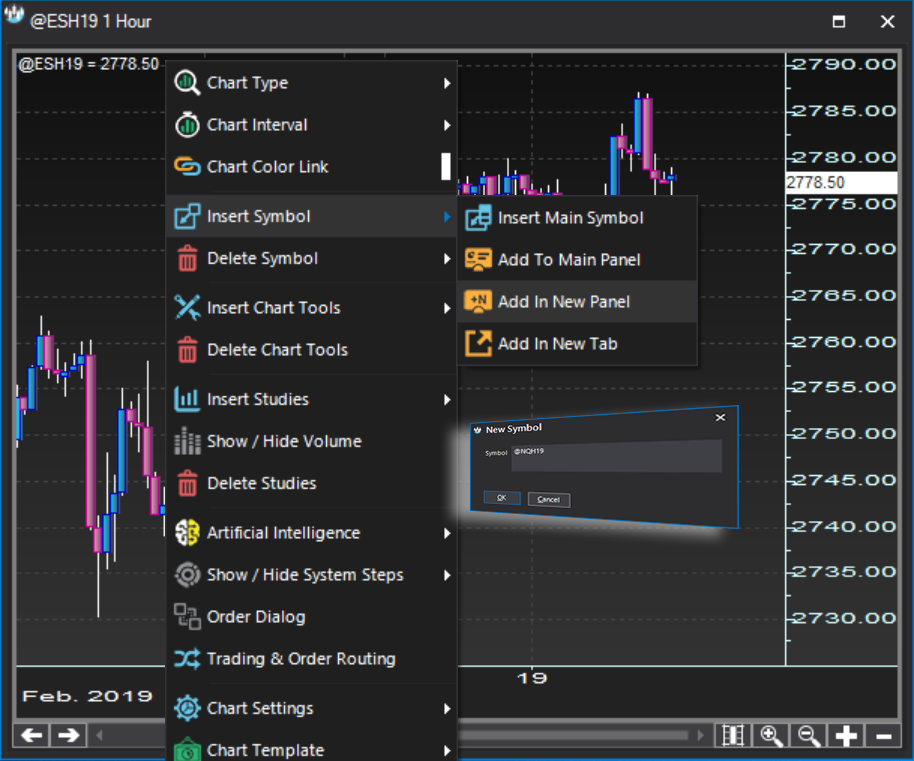
Separate Panel
Separate Tab
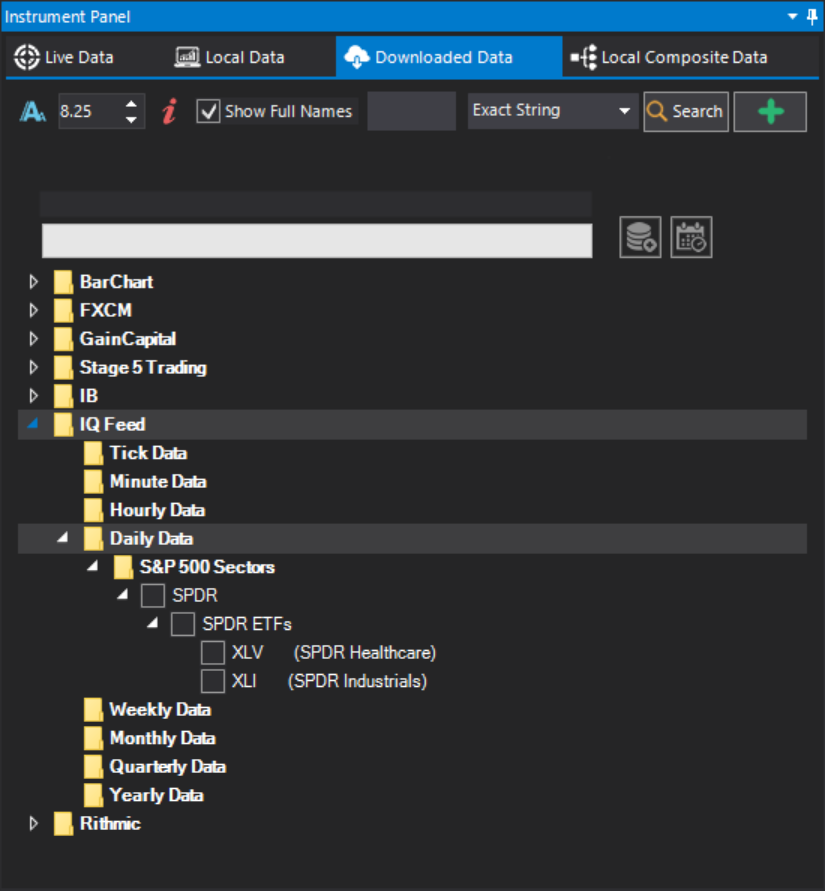
Live Data Composite Symbols
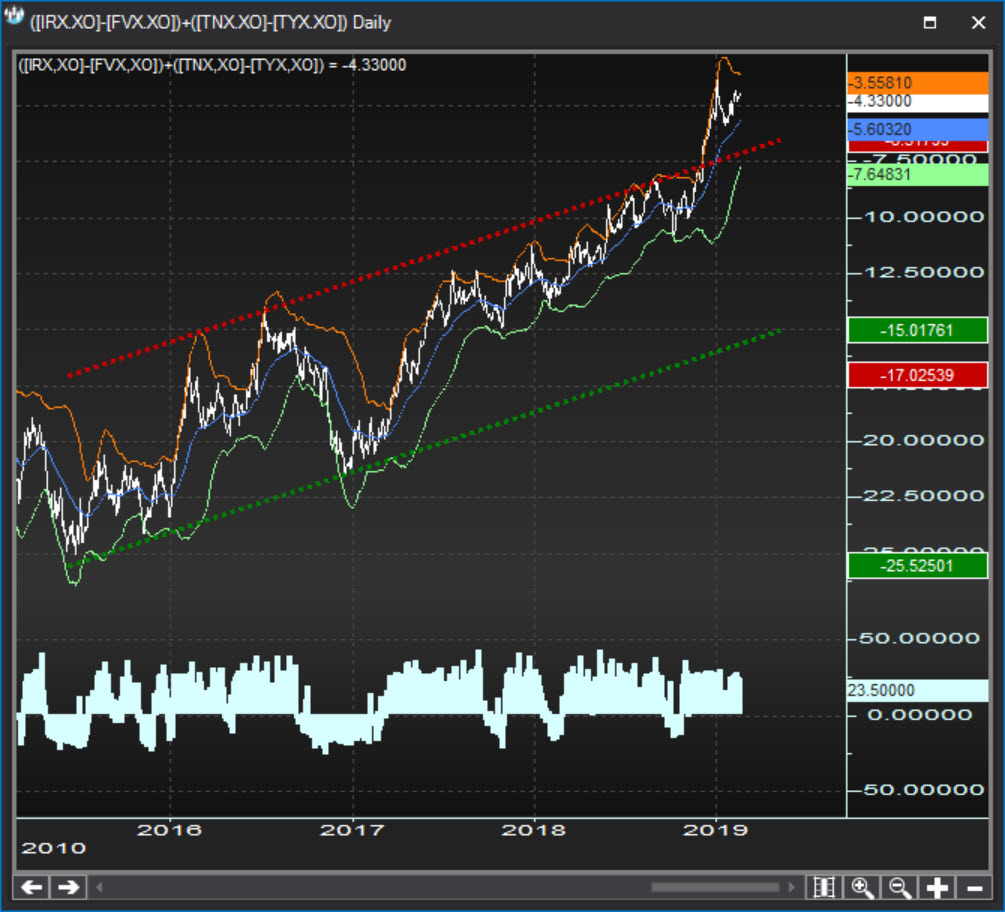
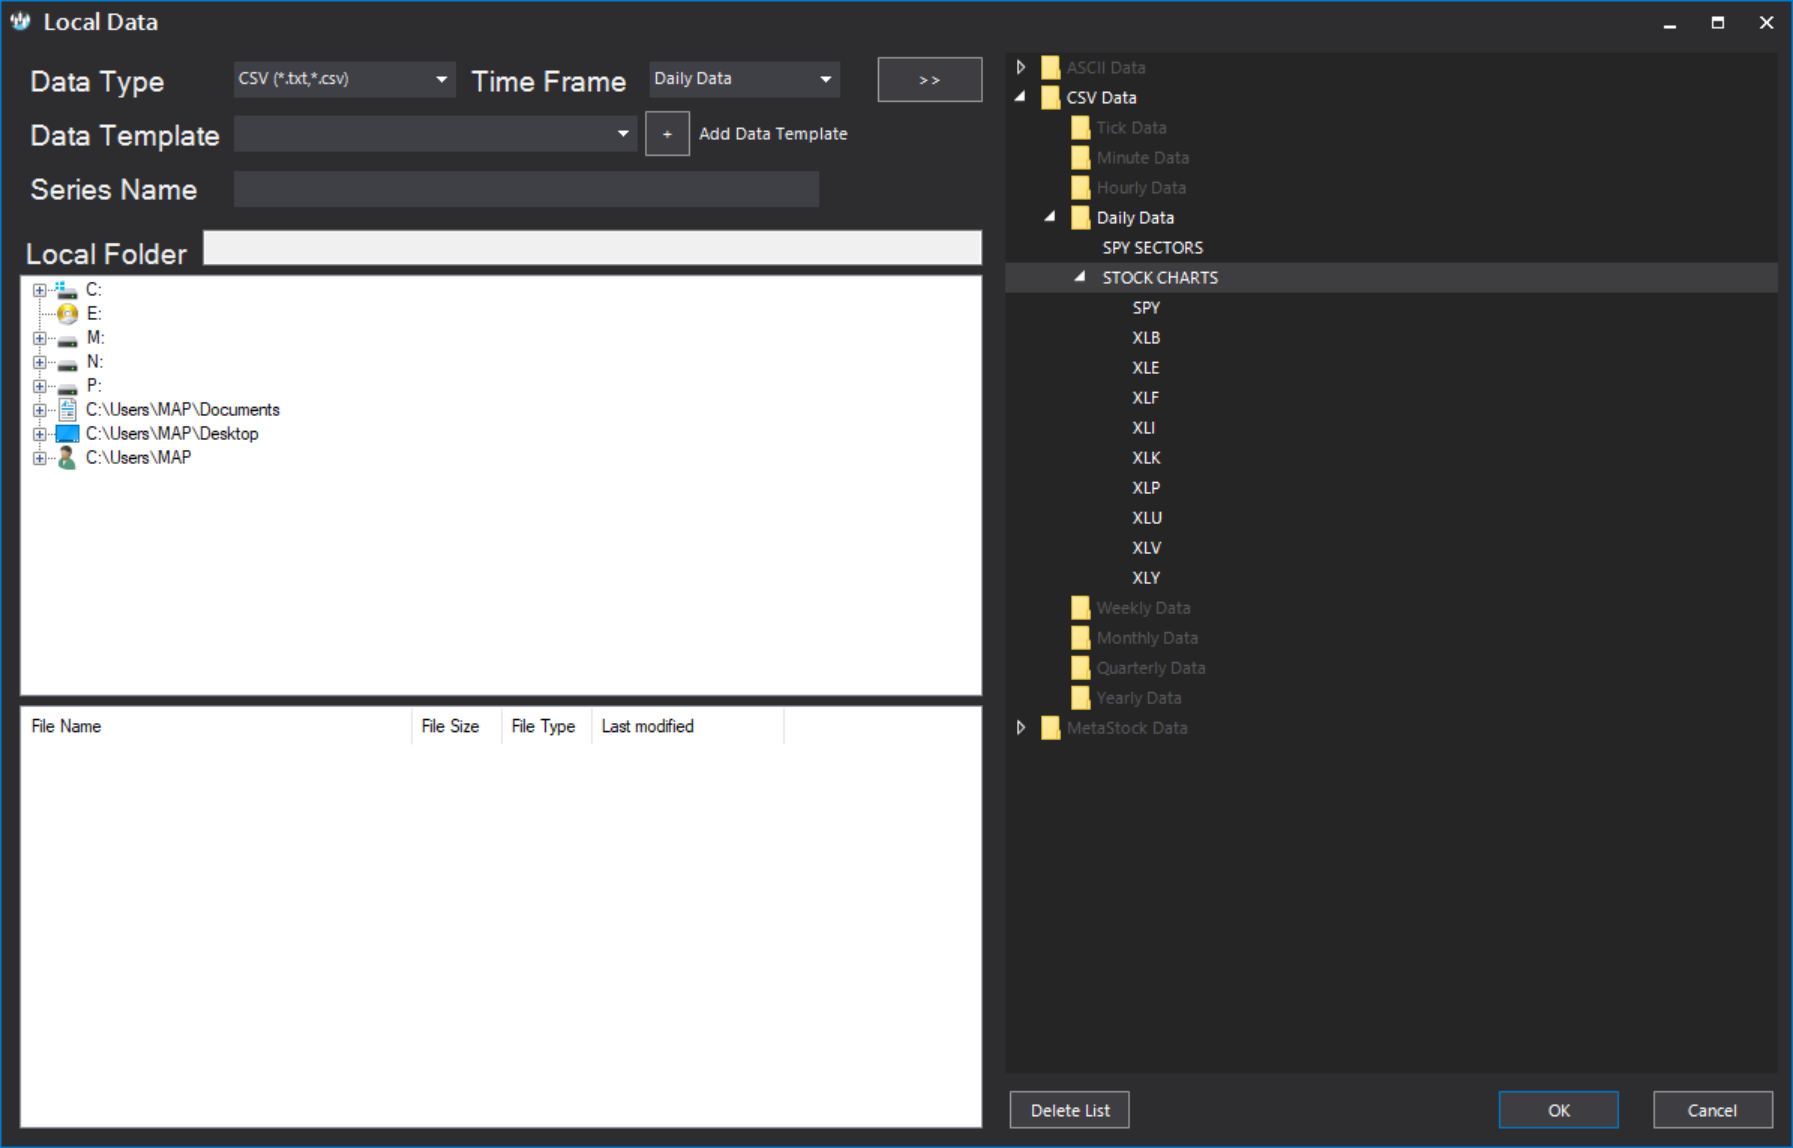
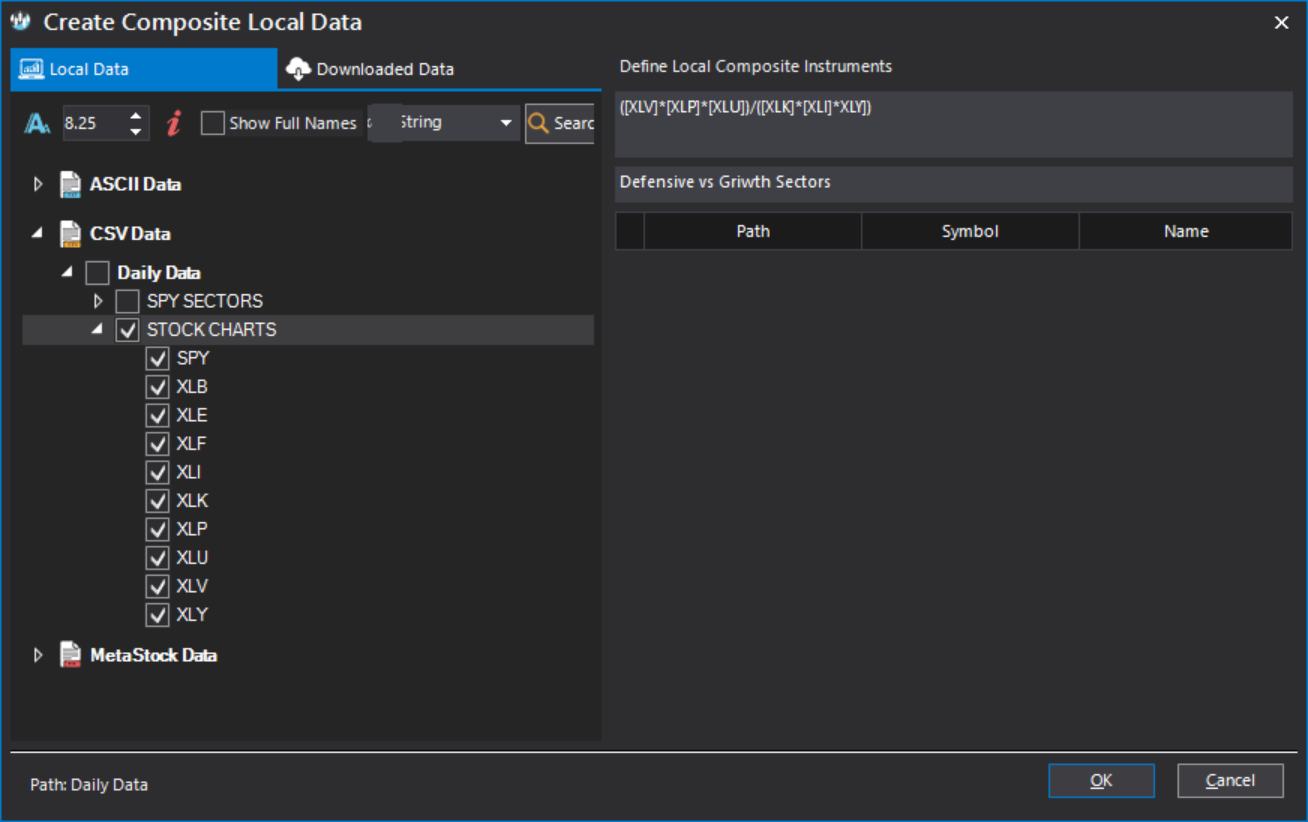
Local Data Composite Symbols
Single & composite symbols.
Plot single or composite symbols in the same panel, on the same chart or on different tabs.