S-Trader Desktop
S-Trader Desktop
  • Charting
    • Introduction


      • Charting Engine Overview
      • Chart Types
      • Chart Time Frames
      • Symbol Management
    • Core Features


      • Annotations & Tools
      • Built-in Studies
      • Custom Studies
      • SVA Studies
      • Expert Advisers
    • Advanced Features


      • Loop System Steps
      • Chart Trading Panel
      • Consensus Reports
    • Working With Charts


      • Chart Settings
      • Chart Templates
      • Chart Management
  • Quant Script
    • Overview


      • At A Glance
      • Primitives
      • Built-in Studies
      • SVA Studies
    • Core Features


      • Code Editor
      • Code Wizard
    • Basic Applications


      • Custom Studies
      • Expert Advisers
      • Consensus Reports
    • Advanced Applications


      • Scripted Alerts
      • Loop Systems
      • Portfolio Systems
  • Full Modules
    • Trading Modules


      • At A Glance
      • Quote List Module
      • Scripted Alerts
      • Loop Systems
    • Relative Strength Modules


      • At A Glance
      • Portfolio Systems
      • Relative Rotation Graphs
    • Auxiliary Models


      • Trade Panel
      • Event Scheduler
      • Premium News
      • Status Panel
    • Platform Tools


      • Organizer
      • Back-Up and Restore
  • Data Feeds
    • Introduction


      • At A Glance
      • Data Feed Comparison
    • Local Data


      • Supported Formats
      • Data Templates
      • Local Data Utility
    • The Instrument Panel


      • Live Data
      • Local Data
      • Downloaded Data
      • Symbol Search
      • Composite Symbols
    • Symbol Utilities


      • XL to XML Symbol Utility
      • IB Symbol Search
  • Order Routing
    • Introduction


      • At A Glance
      • Broker Manager
    • Order Types


      • Available Order Types
      • Auto-Trading
    • Cross-feed Order Routing


      • At A Glance
      • Symbol Pegging
    • Managing Orders


      • From Charts
      • From Order Dialog
      • From Blotter
  • Portfolio Management
    • Desktop Platform


      • Master Account Link
      • Group Order Routing
  • Get Started
    • New to S-Trader ?


      • Software Installation Guide
      • Video Tutorials
    • Licensing


      • Licensing Options
      • Volume Licensing
    • For Individuals


      • S-Trader Community
    • For Institutions


      • Enterprise Solution
      • Fintech Development
×
Search Results

Versatile, efficient, advanced.

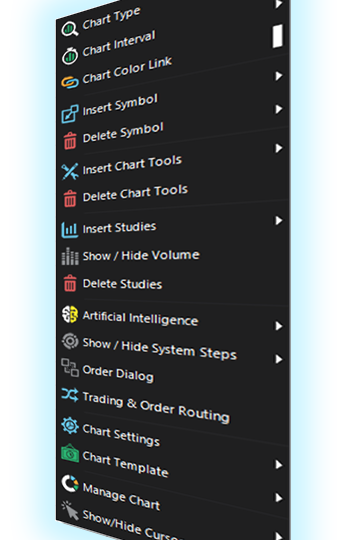
Right click menu-driven

  • Chart Types

    Chart Types

    You can chose from eleven (11) built-in chart types: line, candlestick, bars, point and figure, renko, kagi, three line break, equivolume, equivolume shadow, candle volume, heikin ashi.

  • Chart Time Frames

    Chart Time Frames

    You can plot time frames from tick / second / minute all the way up to daily, weekly and monthly. You can also plot time frames built out of any custom number of ticks, seconds, minutes, hours, days and weeks.

  • Symbol Management

    Symbol Management


    You can plot single symbol, multi-symbol as well as composite symbol charts:

    • Single symbol charts can be built out of any local data file or streaming data source;
    • Multi-symbol can be on a % scale in the same panel or on individual price scales in different panels;
    • Composites can be any combination of any number of individual instruments, sourced from local data files or streaming data sources.


  • Tools & Annotations

    Tools & Annotations


    You have a large choice of chart tools and annotations in the S-Trader’s charting engine.


    • Lines: Trendline, Trendchannel, Vertical Line, Horizontal Line, Speed Lines, Gann Fans, Tirone Levels, Quadrant Lines, Freehand Drawing;
    • Fibonaccis: Retracements, Extensions, Arcs, Fan, Time Zones
    • Channels: Raff Regression, Error Channels
    • Text: Text, Callouts
    • Shapes: Ellipse, Rectangle
    • Symbols


  • Chart Studies

    Chart Studies


    The S-Trader charting engine has a wide selection of built-in technical studies. Additionally, you can easily define any custom study you want using the platform's available Quant Script engine.

    There are over one hundred built-in technical studies available, conveniently grouped in nine different categories:

    • Moving Averages
    • Envelopes
    • Price Oscillators
    • Money Flow Oscillators
    • Trend Indicators
    • Volatility Studies
    • Statistics
    • SVA Studies
    • Chart-only Studies


  • Trade Support Elements

    Trade Support Elements


    You can define expert advisers to show occurrences on charts. You can apply one-to-many advisers on one-to-many symbols on every chart.

    Expert advisers previously defined can be used to build consensus reports in any time frame to determine the frequency of occurrence of certain events over any period of time.


  • Chart Trading

    Chart Trading

    You can manage orders and trade straight from charts.

  • Trading Systems

    Trading Systems

    Apply systems steps on charts and monitor system status in the trade panel.

  • Chart Settings

    Chart Settings


    You can edit any aspect of your chart’s looks via the chart settings menu:

    • Chart Colors;
    • Scale Formats;
    • Bar Density;
    • Display Settings. 


  • Chart Templates

    Chart Templates


    You can save preferred chart settings, including built-in and custom studies and their formats, as chart templates that can be subsequently applied very easily to other charts.


Azoom | Responsive Wordpress Theme

All content on this website is copyright protected material of S-Trader.com and its partners

Quick Links


  • Privacy Policy
  • Legal – Please read carefully
  • Snapshot Gallery

Partners & Affiliates


  • Affiliates Sign-Up
  • Affiliate login
  • Fintech Development
© Copyright www.s-trader.com, 2004-2018