S-Trader Desktop
S-Trader Desktop
  • Charting
    • Introduction


      • Charting Engine Overview
      • Chart Types
      • Chart Time Frames
      • Symbol Management
    • Core Features


      • Annotations & Tools
      • Built-in Studies
      • Custom Studies
      • SVA Studies
      • Expert Advisers
    • Advanced Features


      • Loop System Steps
      • Chart Trading Panel
      • Consensus Reports
    • Working With Charts


      • Chart Settings
      • Chart Templates
      • Chart Management
  • Quant Script
    • Overview


      • At A Glance
      • Primitives
      • Built-in Studies
      • SVA Studies
    • Core Features


      • Code Editor
      • Code Wizard
    • Basic Applications


      • Custom Studies
      • Expert Advisers
      • Consensus Reports
    • Advanced Applications


      • Scripted Alerts
      • Loop Systems
      • Portfolio Systems
  • Full Modules
    • Trading Modules


      • At A Glance
      • Quote List Module
      • Scripted Alerts
      • Loop Systems
    • Relative Strength Modules


      • At A Glance
      • Portfolio Systems
      • Relative Rotation Graphs
    • Auxiliary Models


      • Trade Panel
      • Event Scheduler
      • Premium News
      • Status Panel
    • Platform Tools


      • Organizer
      • Back-Up and Restore
  • Data Feeds
    • Introduction


      • At A Glance
      • Data Feed Comparison
    • Local Data


      • Supported Formats
      • Data Templates
      • Local Data Utility
    • The Instrument Panel


      • Live Data
      • Local Data
      • Downloaded Data
      • Symbol Search
      • Composite Symbols
    • Symbol Utilities


      • XL to XML Symbol Utility
      • IB Symbol Search
  • Order Routing
    • Introduction


      • At A Glance
      • Broker Manager
    • Order Types


      • Available Order Types
      • Auto-Trading
    • Cross-feed Order Routing


      • At A Glance
      • Symbol Pegging
    • Managing Orders


      • From Charts
      • From Order Dialog
      • From Blotter
  • Portfolio Management
    • Desktop Platform


      • Master Account Link
      • Group Order Routing
  • Get Started
    • New to S-Trader ?


      • Software Installation Guide
      • Video Tutorials
    • Licensing


      • Licensing Options
      • Volume Licensing
    • For Individuals


      • S-Trader Community
    • For Institutions


      • Enterprise Solution
      • Fintech Development
×
Search Results

Equity valuation studies.

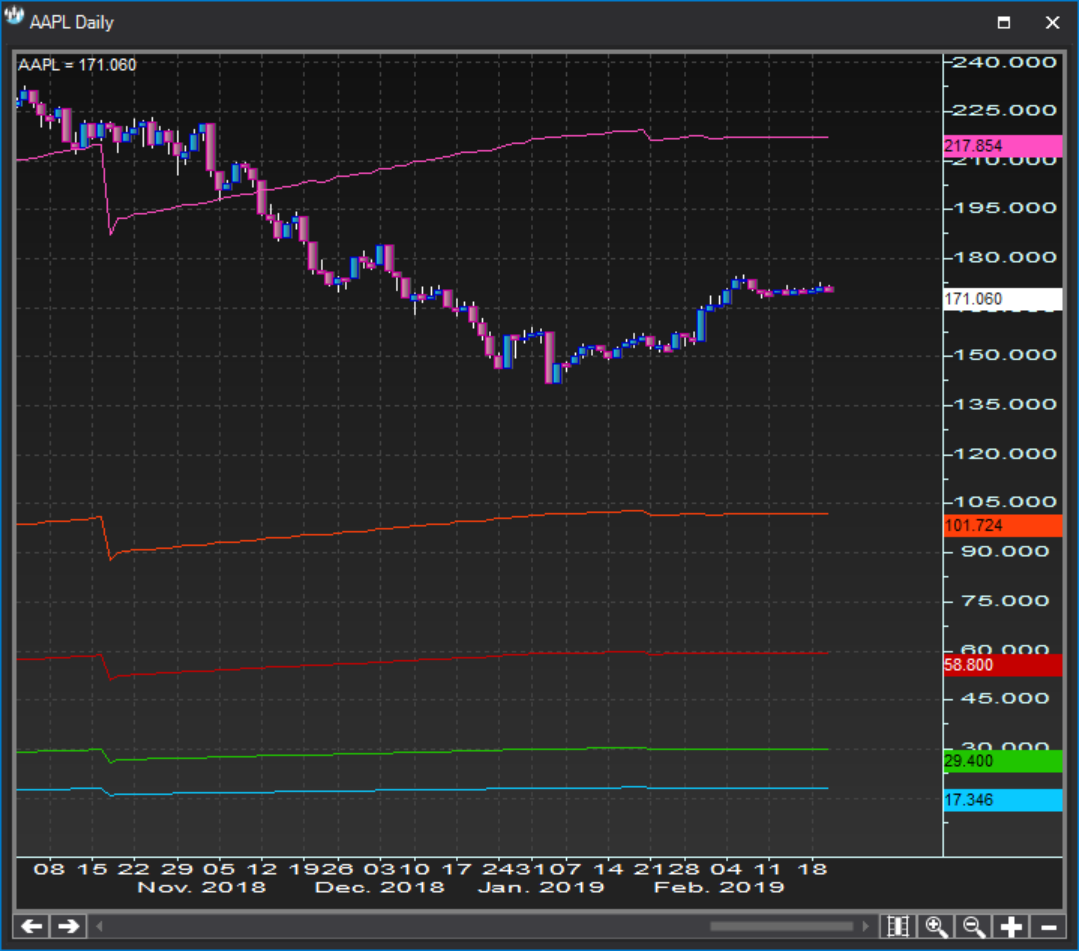
Valuation studies derived directly from company balance sheet data to understand and model intrinsic values. Compare benchmark and actual valuation multiples to understand how fundamental value is created or eroded. 

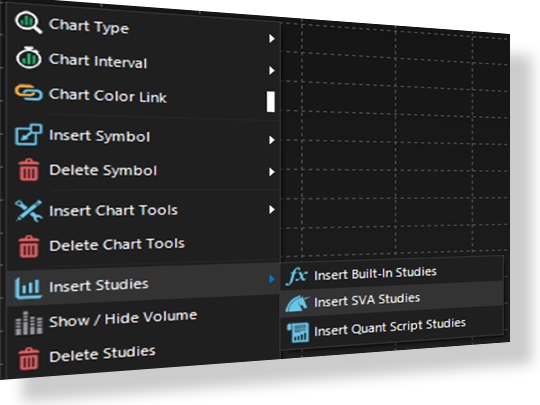
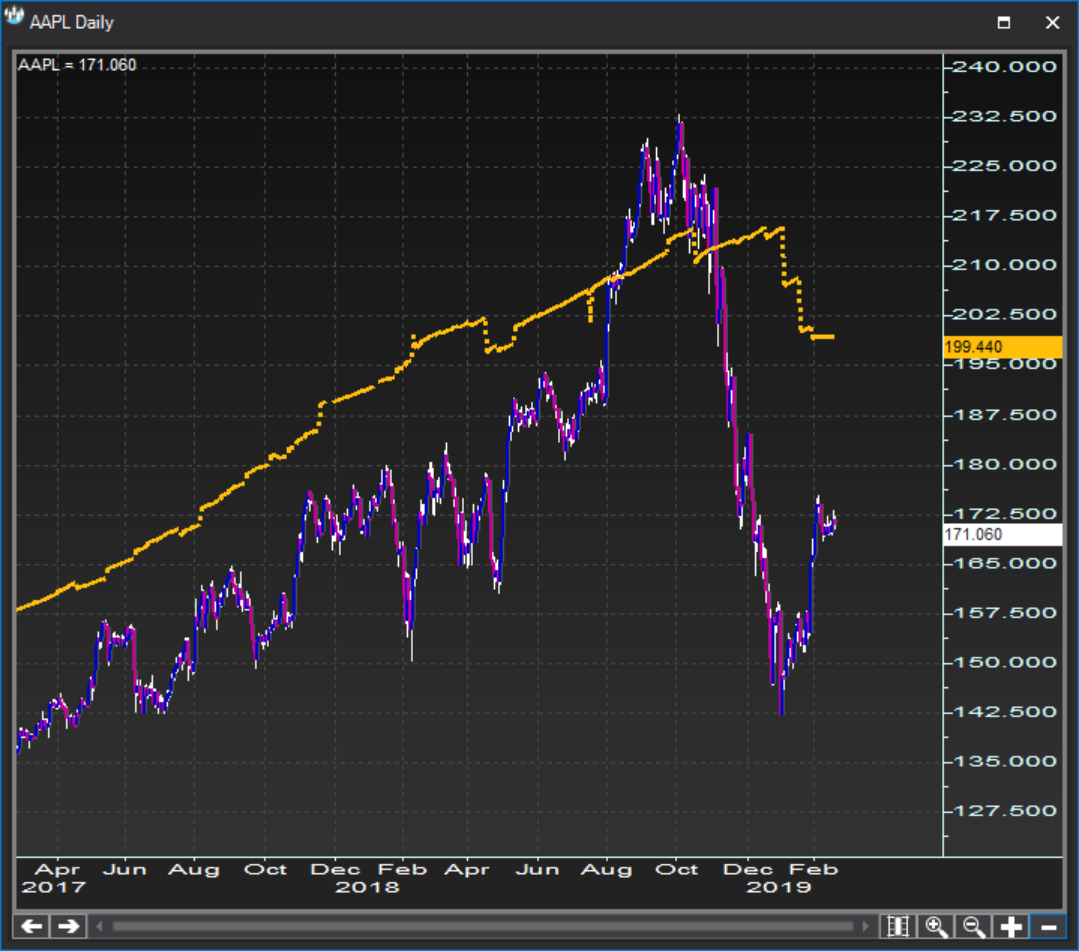
The SVA equity valuation studies are extremely relevant to equity traders and investors. Thanks to our partnership with our friends at Strategic Analysis Corporation (1994), the S-Trader platform gives you the ability to plot popular technical studies and fundamental studies based on balance sheet analysis all in the same frame / window. In addition, the Quant ScriptTM engine allows you to write scripts using the built-in technical and statistical functions, the SVA equity valuation functions or a combination of both. The SVA equity valuation functions can in fact be nested at any iteration inside any other technical and statistical function for some truly powerful and objective analysis and scripting on the firm’s intrinsic value and stability, as they result directly from the firm’s balance sheet.

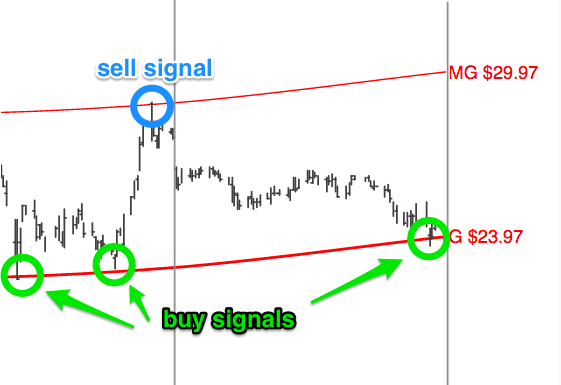
SVA Price Multiple function

This function returns the relevant price multiples of the stock. 

Bubble Valuation Multiples

  • High Bubble 8 (HB8)
  • High Bubble 7 (HB7)
  • High Bubble 6 (HB6)
  • High Bubble 5 (HB5)
  • High Bubble 4 (HB8)
  • High Bubble 3 (HB3)
  • High Bubble 2 (HB2)
  • High Bubble 1 (HB1)
  • Bubble (BB)

Growth Valuation Multiples

  • Mid Super Growth (MSG)
  • Low Super Growth (LSG)
  • Super Growth (SG)
  • Mid Growth (MG)
  • Growth (G)

Normal Valuation Multiples

  • High Conservation (HC)
  • High-Mid (HM)
  • Normal (G)
  • Low-Mid (LM)
  • Low Conservation (LC)

Blue Valuation Multiples

  • Blue (BL)
  • Deep Blue 1 (DB1)
  • Deep Blue 2 (DB2)
  • Deep Blue 3 (DB3)
  • Deep Blue 4 (DB4)
  • Deep Blue 5 (DB5)
  • Deep Blue 6 (DB6)
Future Market Value function

This function returns the inferred future fair value of the stock.

Stability Ratio function

This function measures the balance sheet stability of the stock and can be viewed as a forward-looking measure of future stock price volatility.

Azoom | Responsive Wordpress Theme

All content on this website is copyright protected material of S-Trader.com and its partners

Quick Links


  • Privacy Policy
  • Legal – Please read carefully
  • Snapshot Gallery

Partners & Affiliates


  • Affiliates Sign-Up
  • Affiliate login
  • Fintech Development
© Copyright www.s-trader.com, 2004-2018