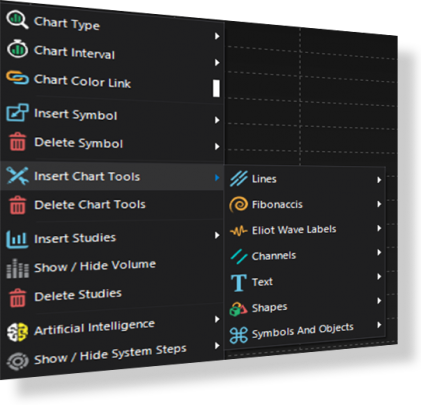
Large selection of chart tools.
Comprehensive chart tools and annotations kit with available lines, fibonaccis, elliott wave labels, channels, text, shapes and more for complete analyses.
Line tools
- TrendlinesContext menu
Context menu Trendlines
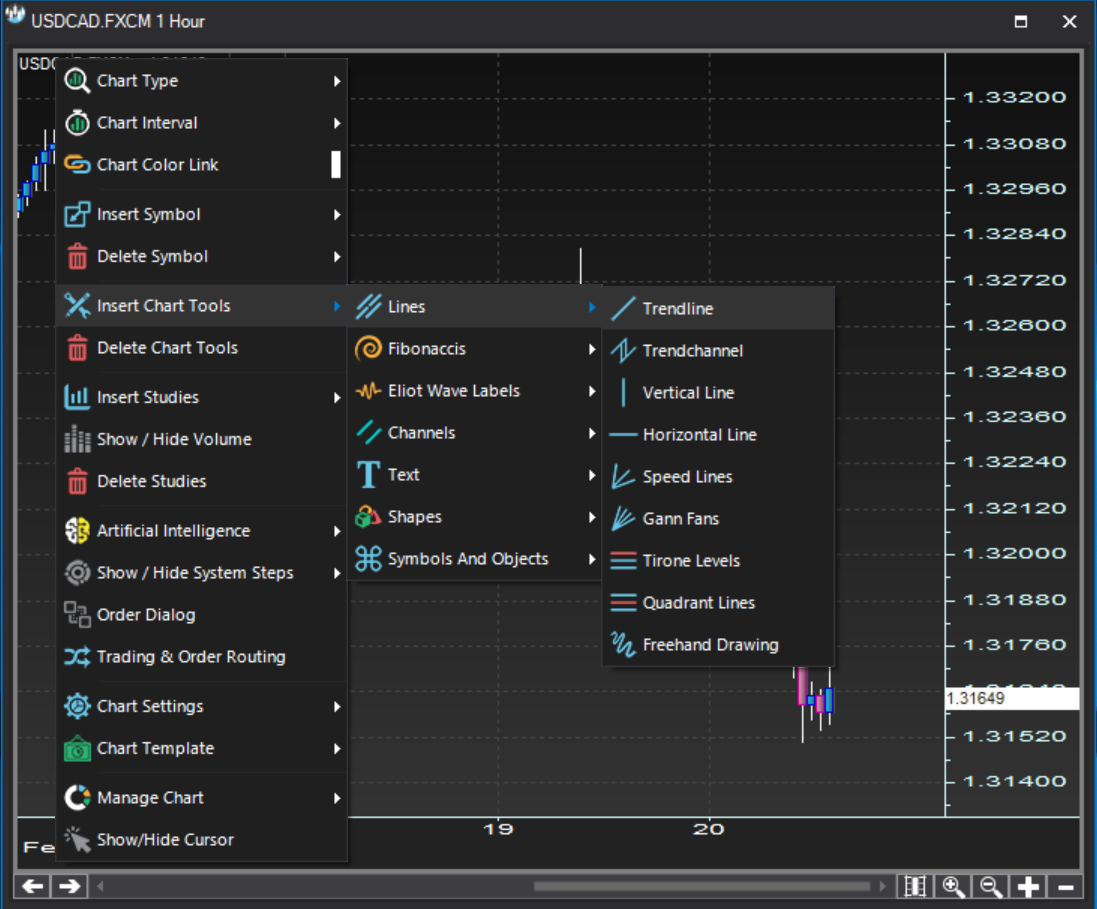
Trendlines are available under the option:
Right click >> Insert chart tools >> Lines >> Trendline
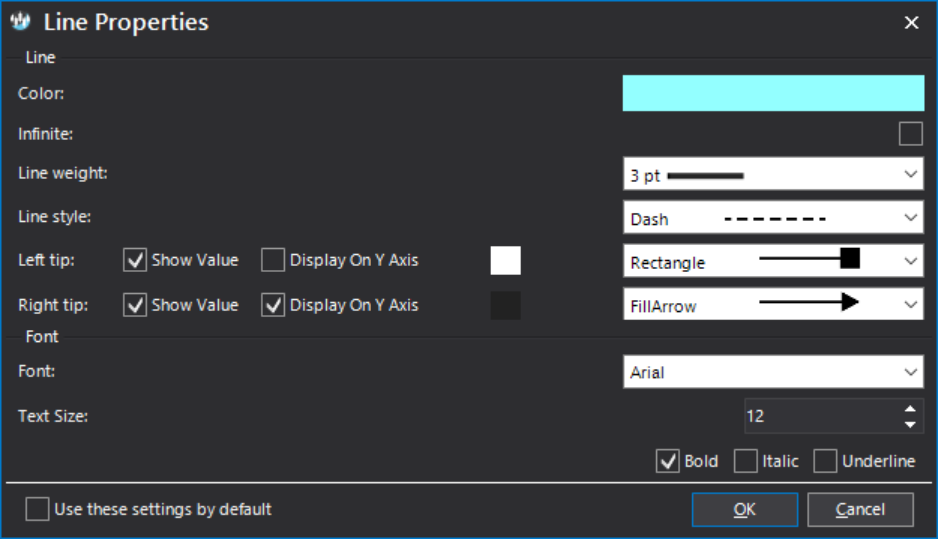
- TrendlinesProperties dialog
Properties dialog Trendlines
The Line Properties dialog allows you to customize the trendline features, including the color, the weight, the style, the tip formats and, if applicable, the value fonts.
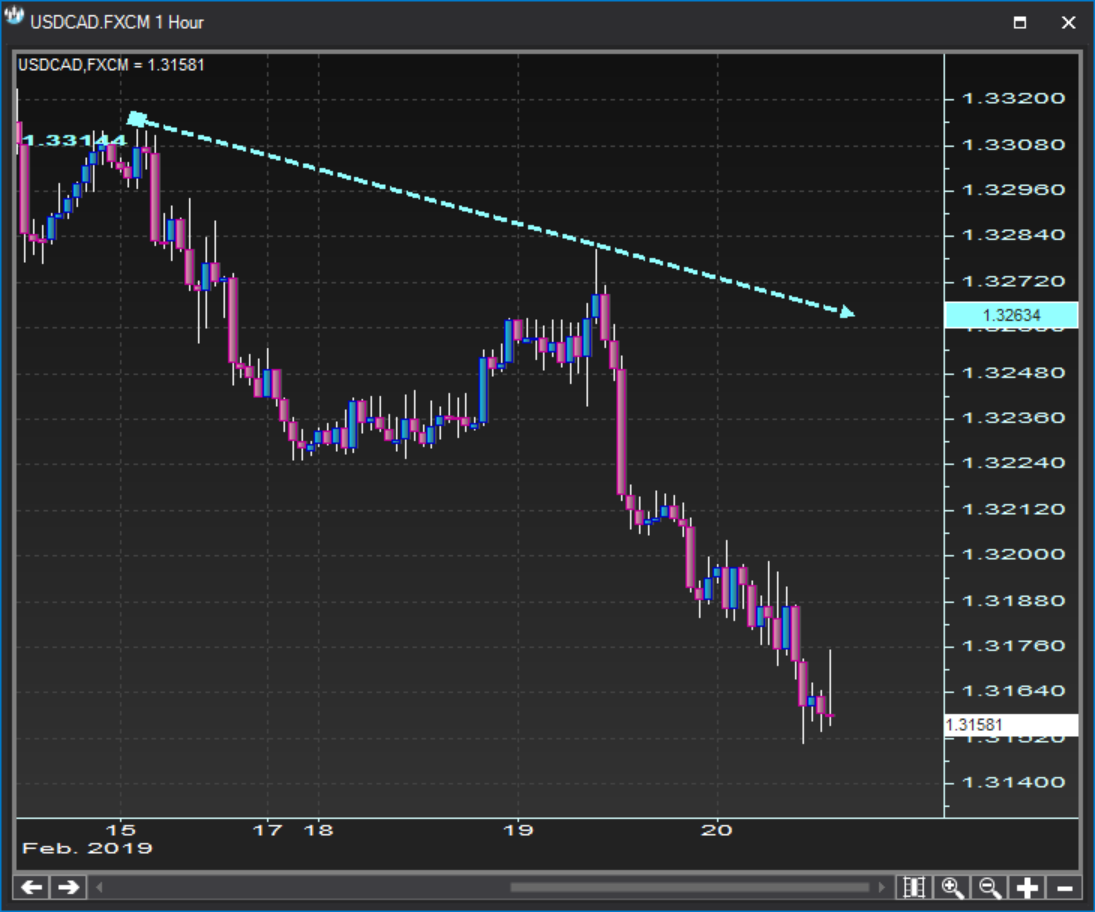
- TrendlinesChart plot
Chart plot Trendlines
Shown below is an example of a trendline drawn on a chart.
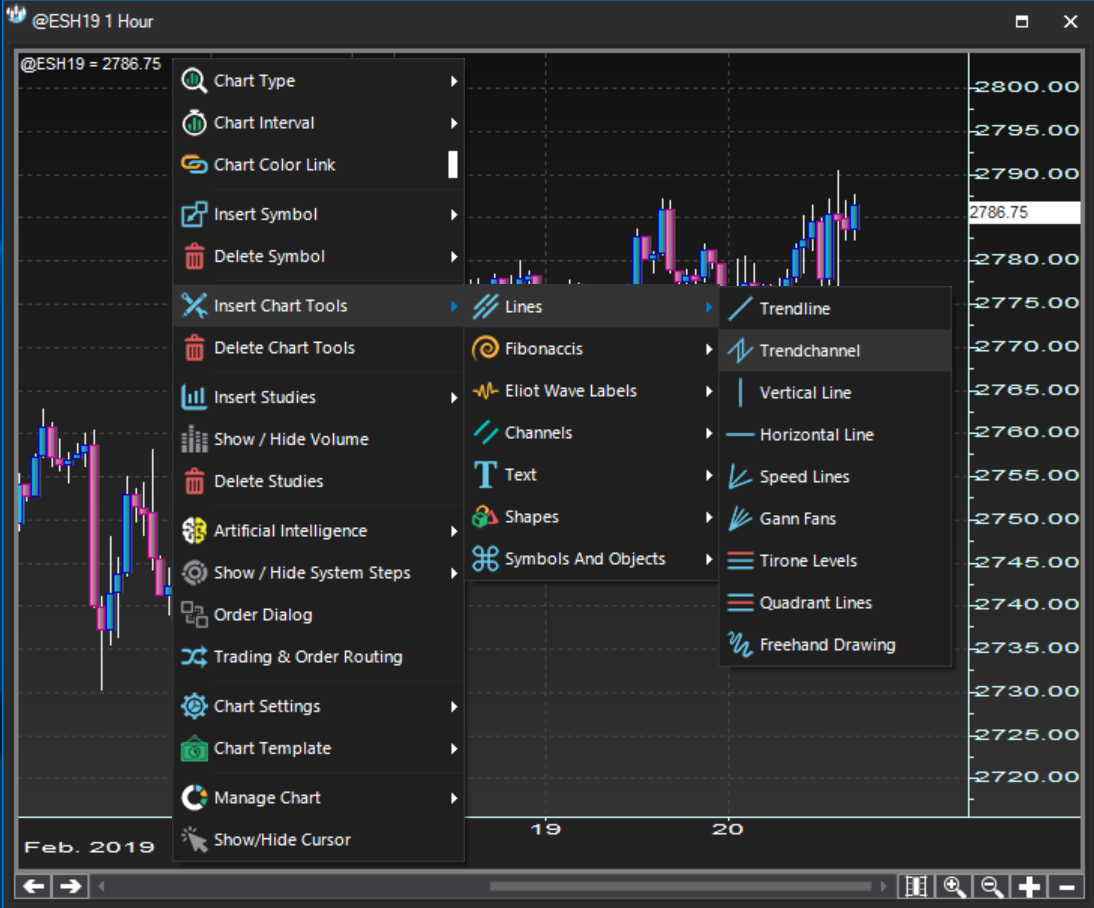
- TrendchannelContext menu
Context menu Trendchannel
Trendchannels are available under the option:
Right click >> Insert chart tools >> Lines >> Trendchannel
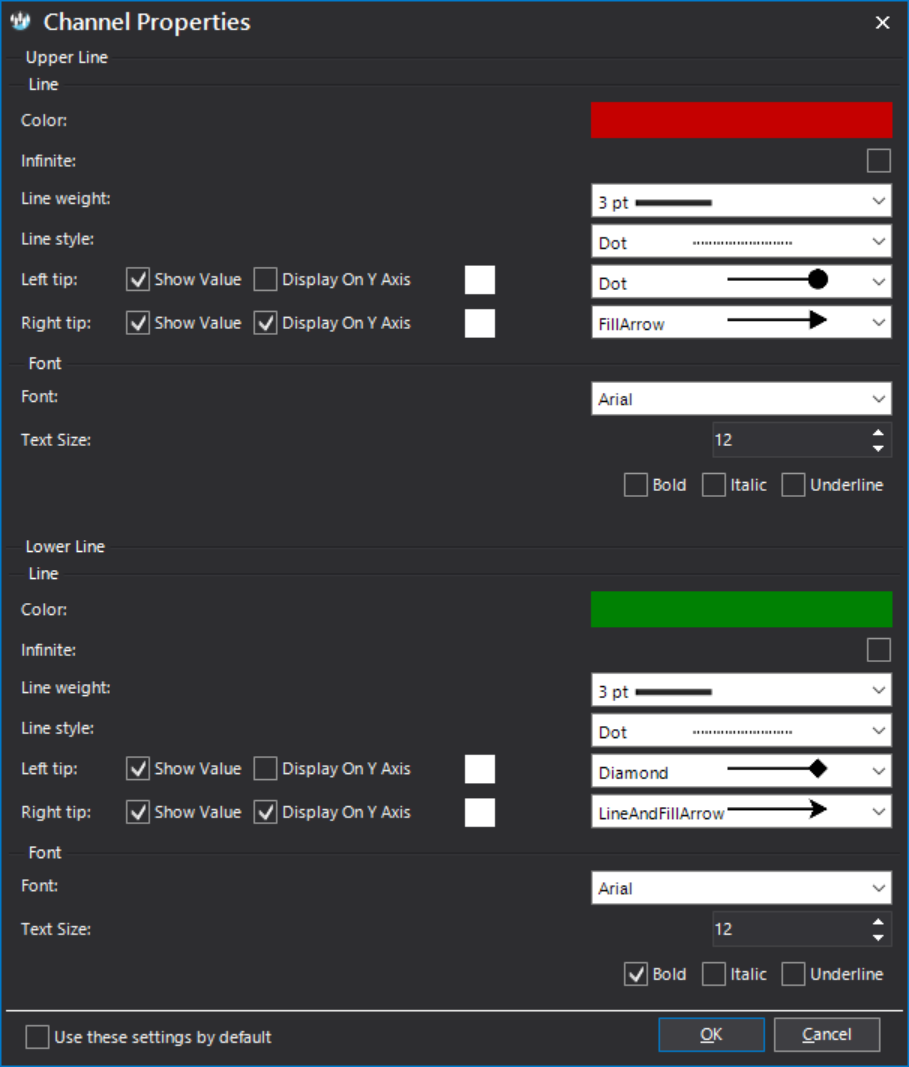
- TrendchannelProperties dialog
Properties dialog Trendchannel
The Channel Properties dialog allows you to customize the channel features line by line. You can set independently for each trendchannel line the color, the weight, the style, the tip formats and, if applicable, the value fonts.
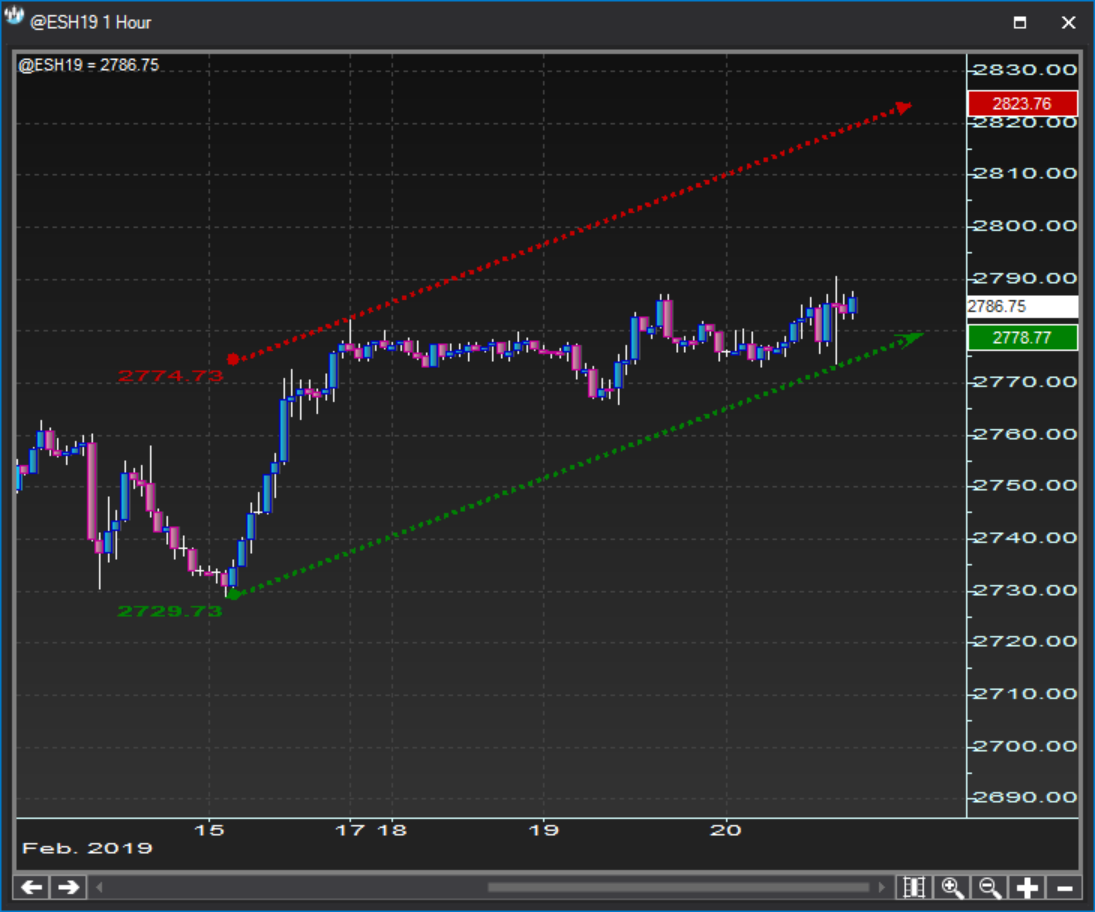
- TrendchannelChart plot
Chart plot Trendchannel
Shown below is an example of a trendchannel drawn on a chart.
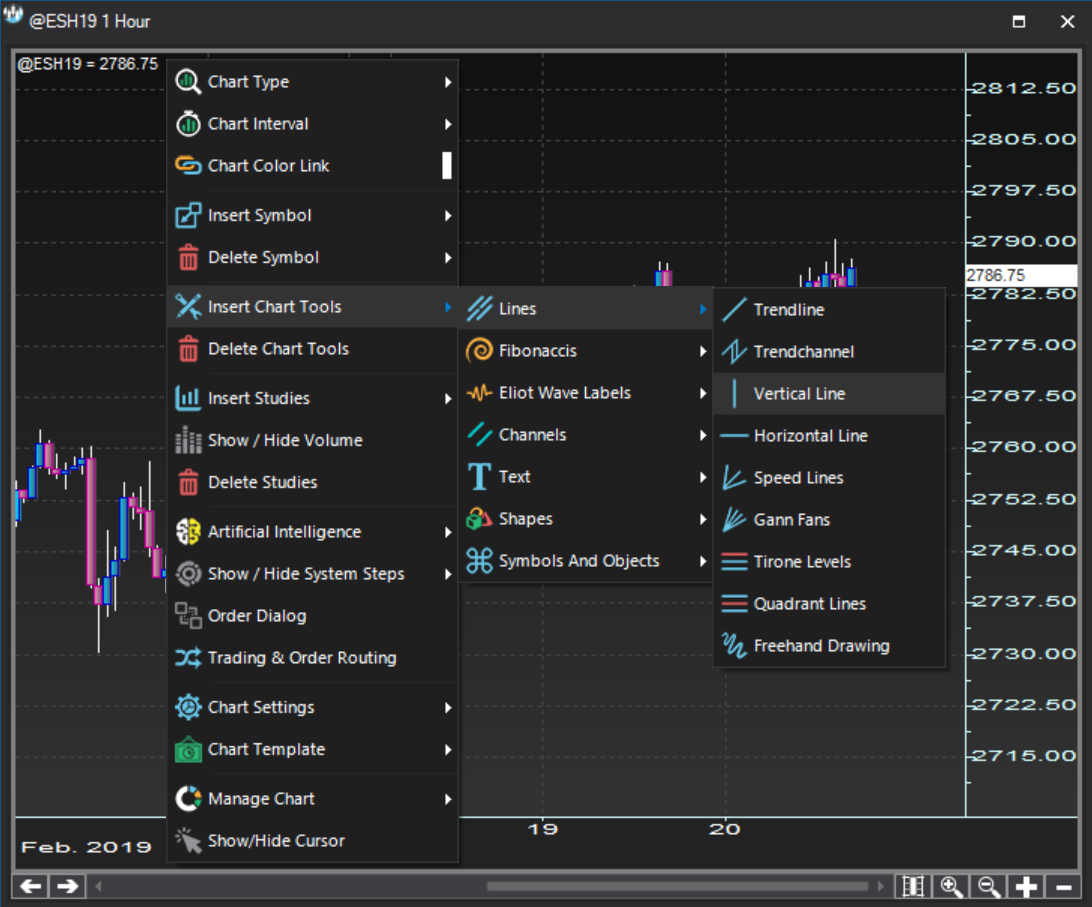
- Vertical lineContext menu
Context menu Vertical line
Vertical lines are available under the option:
Right click >> Insert chart tools >> Lines >> Vertical Line
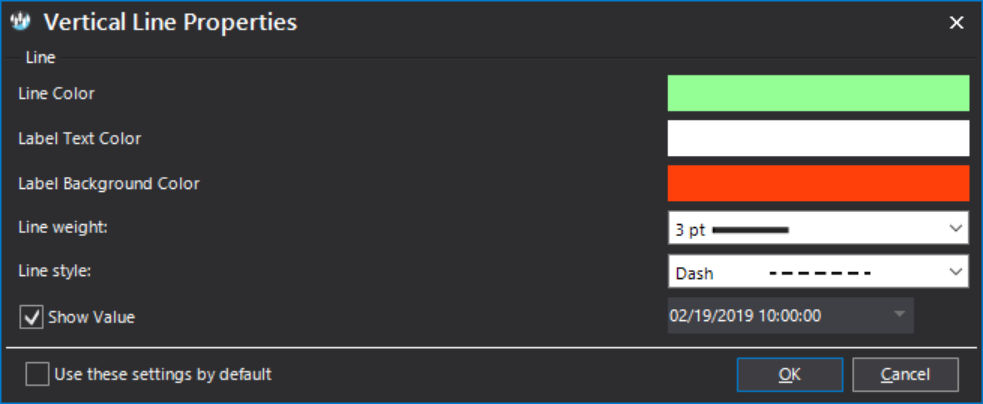
- Vertical lineProperties dialog
Properties dialog Vertical line
The Vertical Line Properties dialog allows you to customize the vertical line features, including color, weight, style, label background and label text.
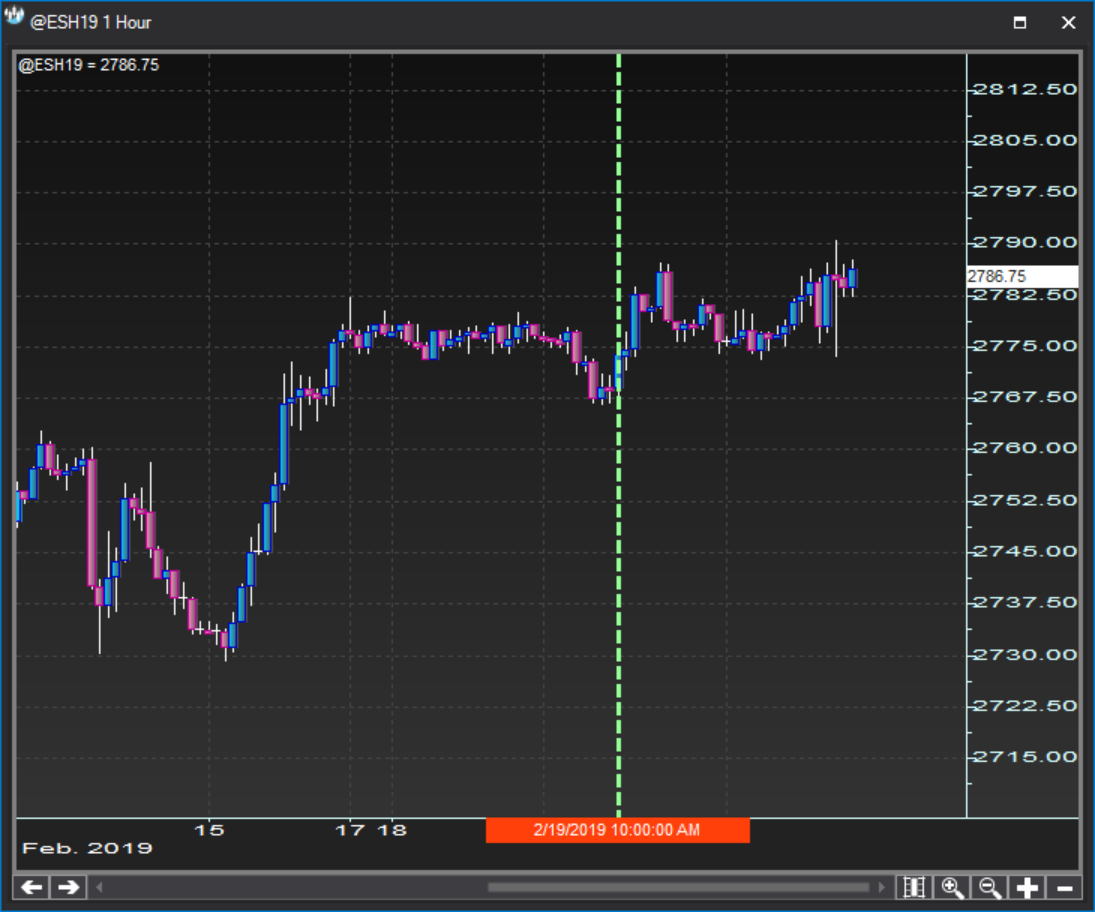
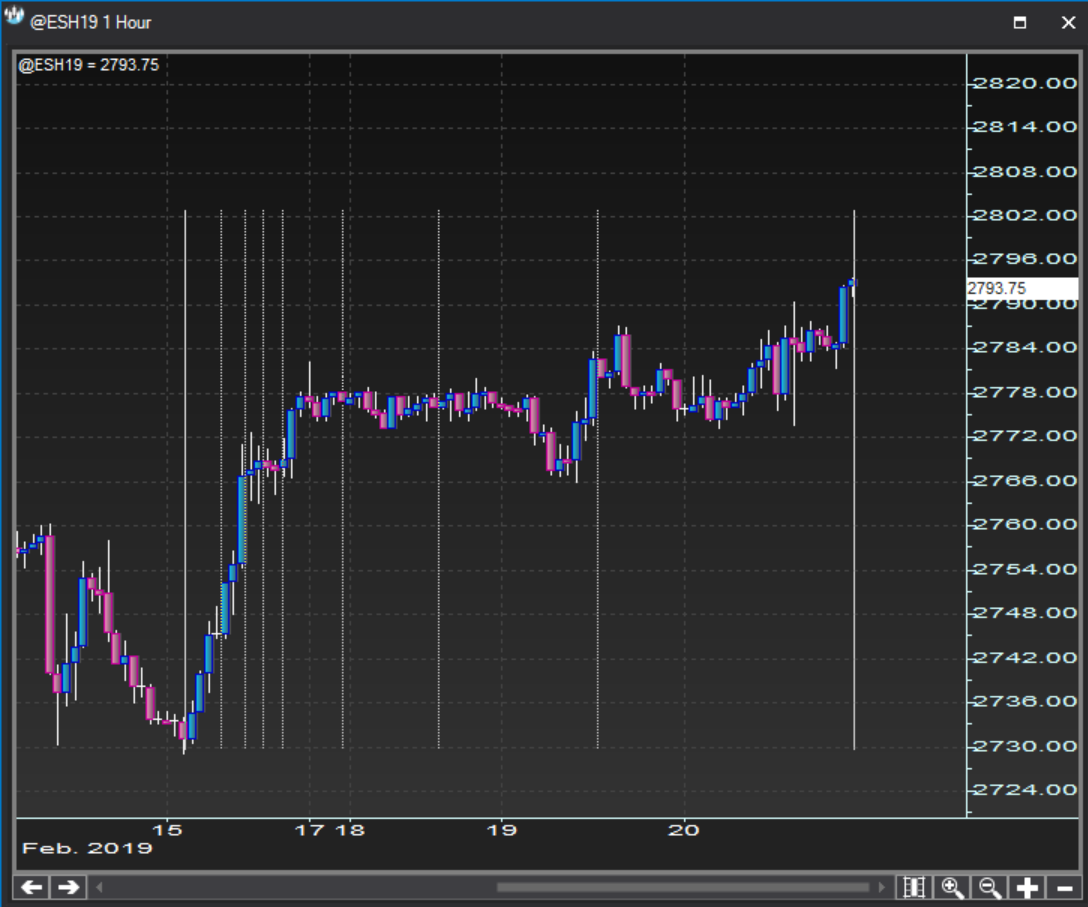
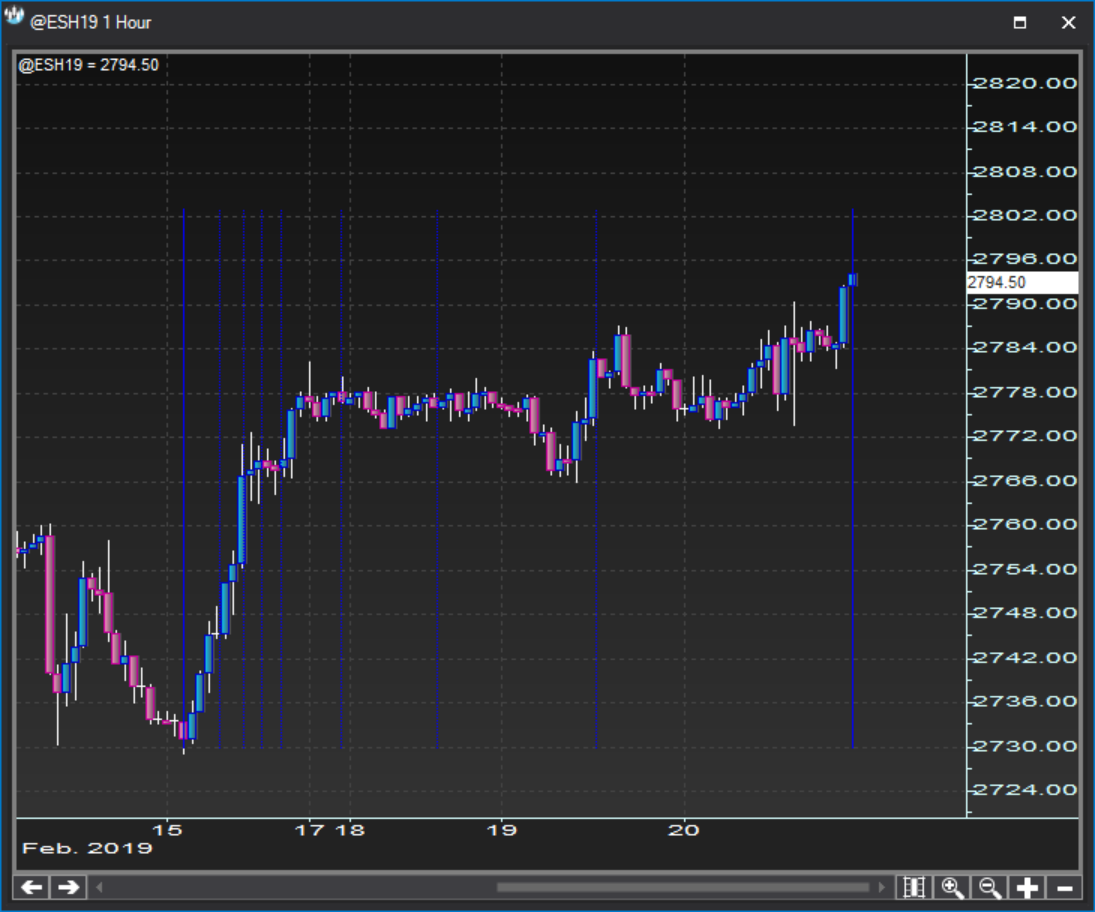
- Vertical lineChart plot
Chart plot Vertical line
Shown below is an example of a vertical line drawn on a chart.
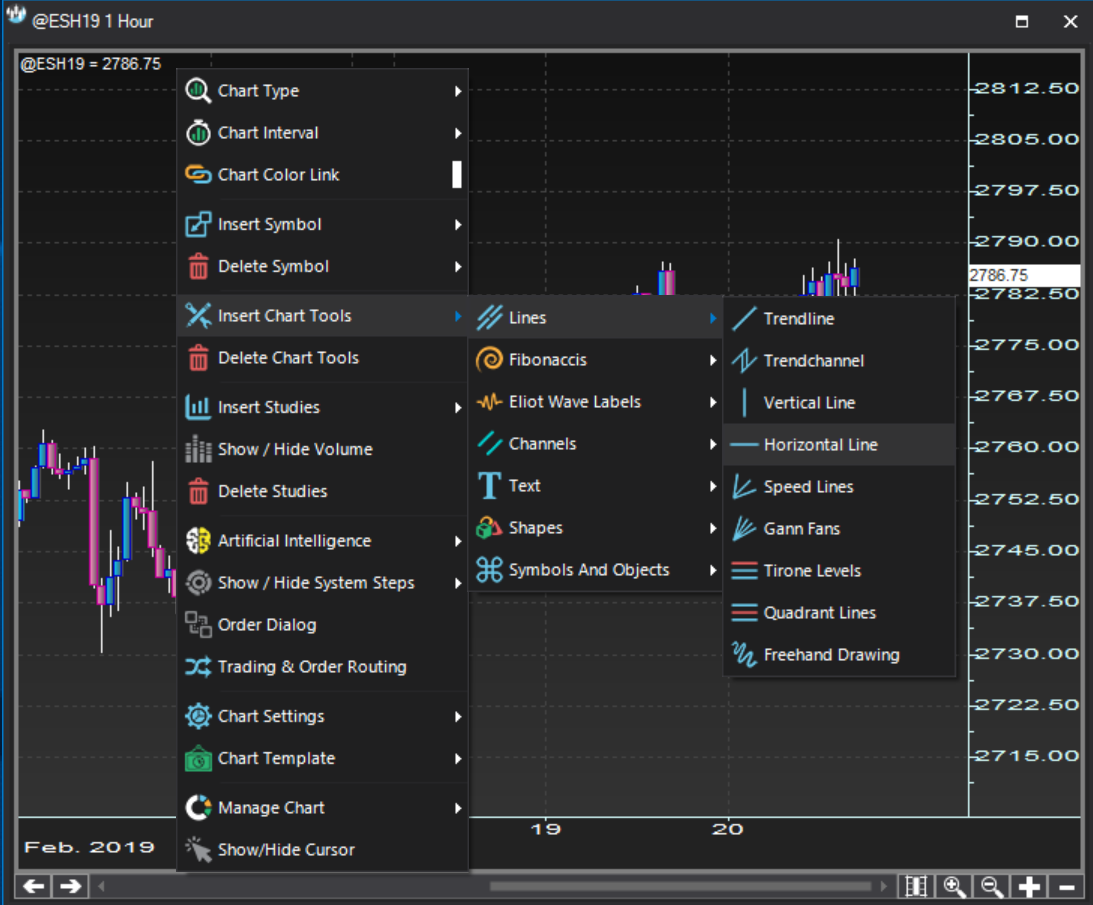
- Horizontal lineContext menu
Context menu Horizontal line
Horizontal lines are available under the option:
Right click >> Insert chart tools >> Lines >> Horizontal Line
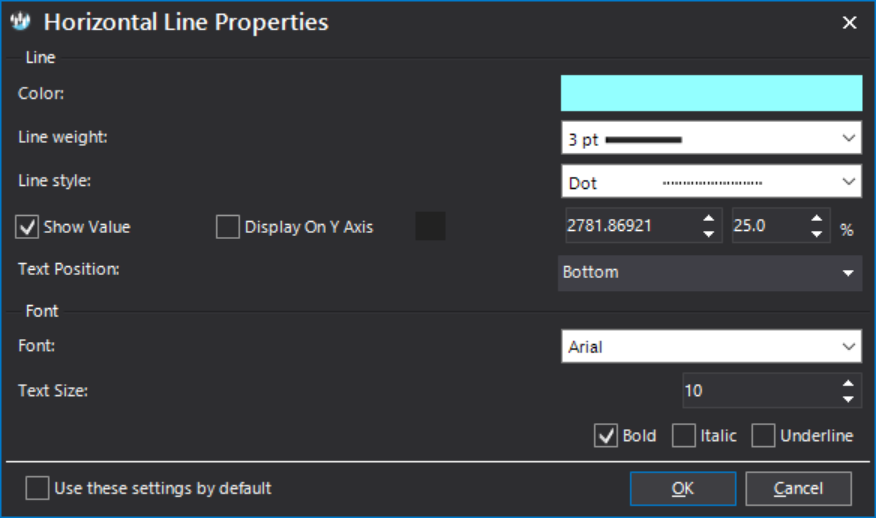
- Horizontal lineProperties dialog
Properties dialog Horizontal line
The Horizontal Line Properties dialog allows you to customize the horizontal line features, including color, weight, style, the pegged value and the value fonts.
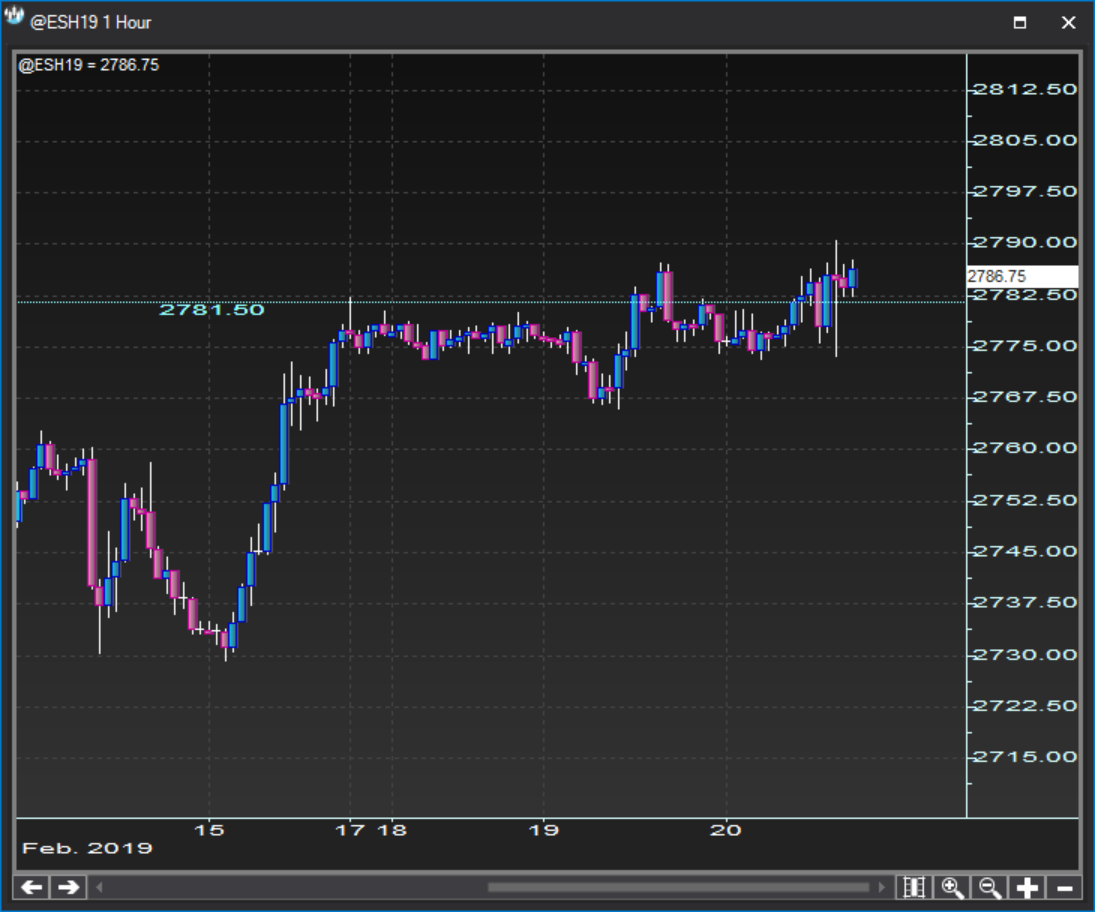
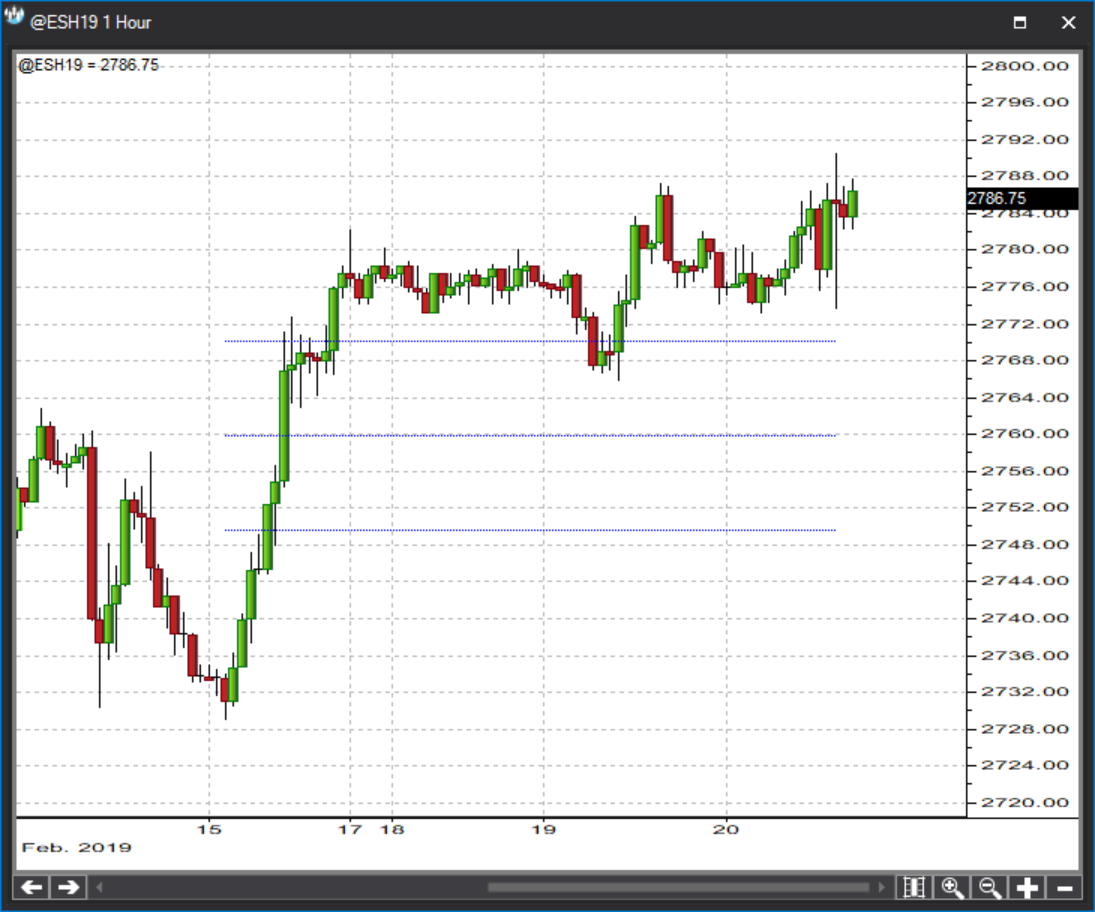
- Horizontal lineChart plot
Chart plot Horizontal line
Shown below is an example of a horizontal line drawn on a chart.
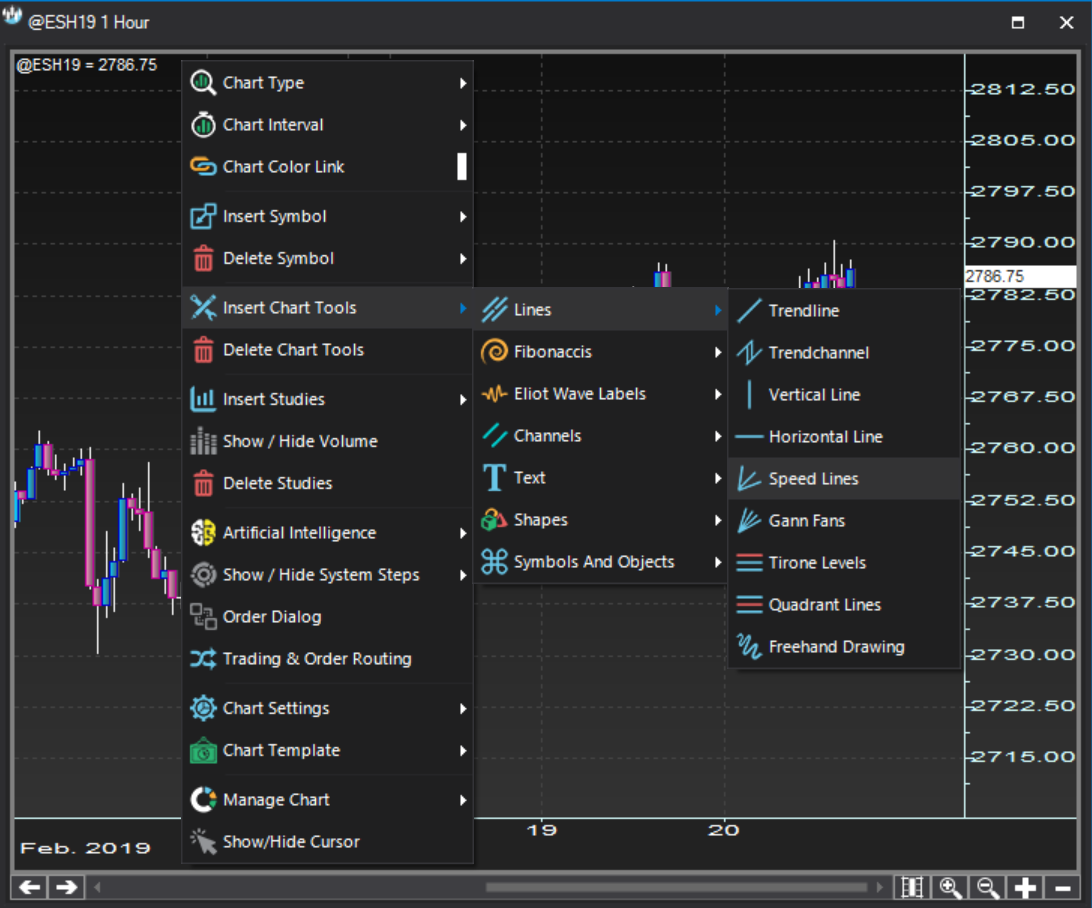
- Speed linesContext menu
Context menu Speed lines
Speed lines are available under the option:
Right click >> Insert chart tools >> Lines >> Speed Lines
- Speed linesProperties dialog
Properties dialog Speed lines
The Speed Lines Properties dialog is a two stage dialog. You can first set which lines to show based on specific proportions. Subsequently, you can customize each speed line look through the Line Properties dialog.

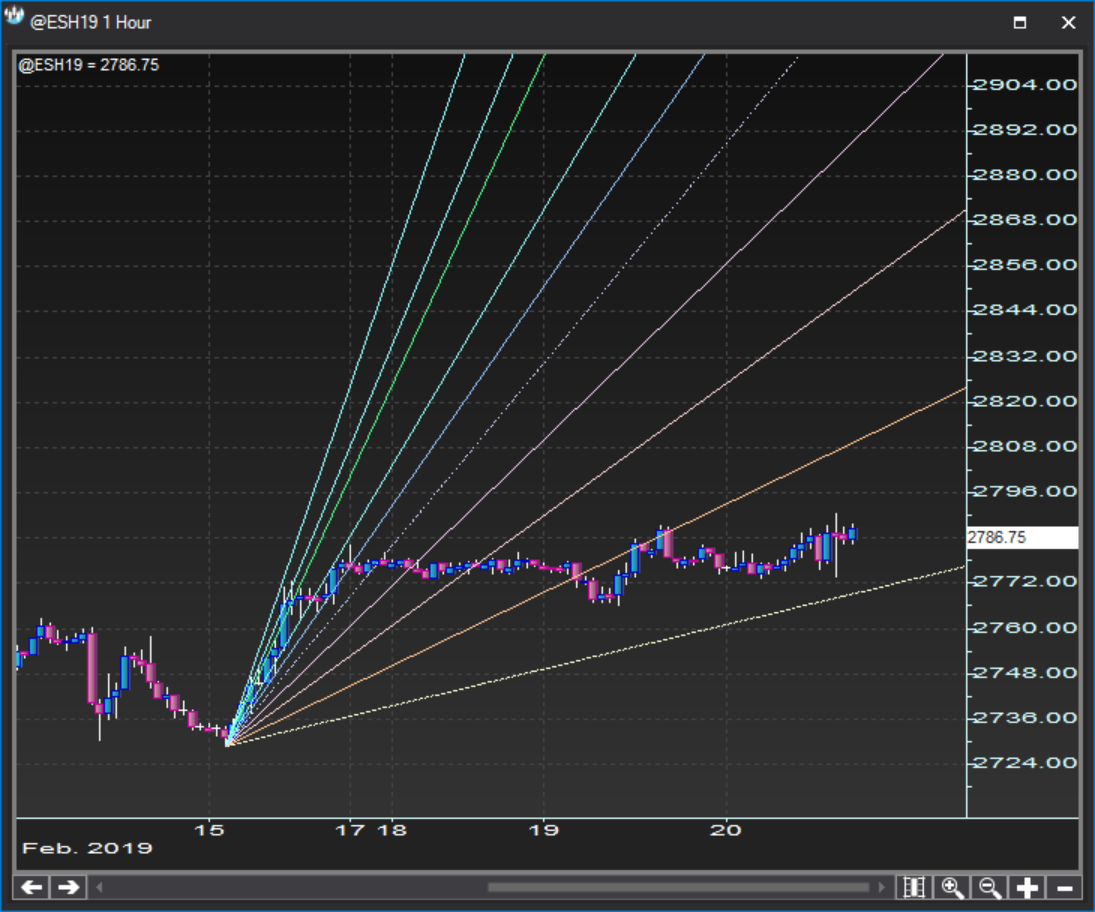
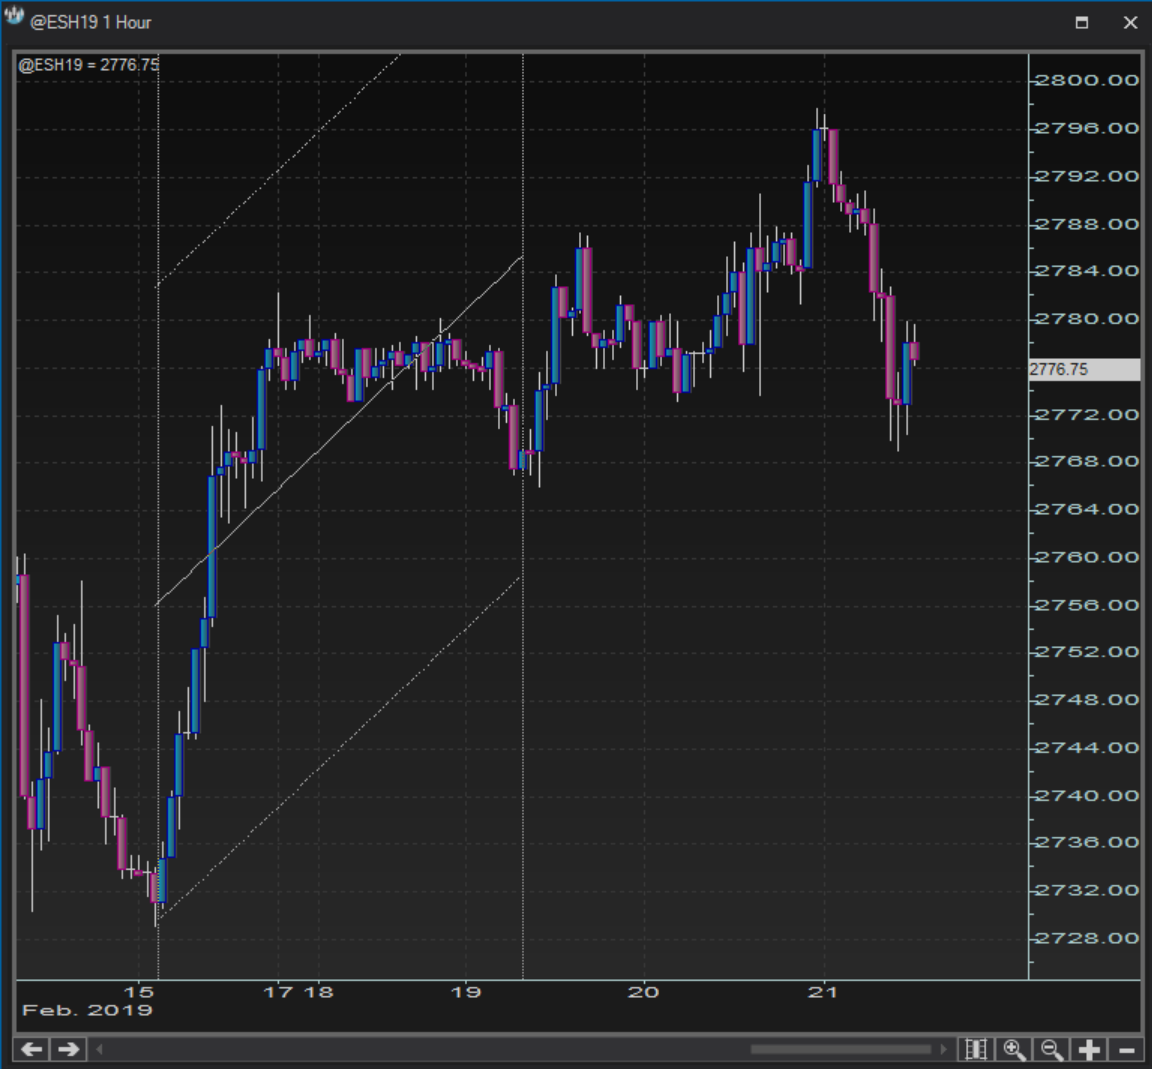
- Speed linesChart plot
Chart plot Speed lines
Shown below is an example of speed lines drawn on a chart.
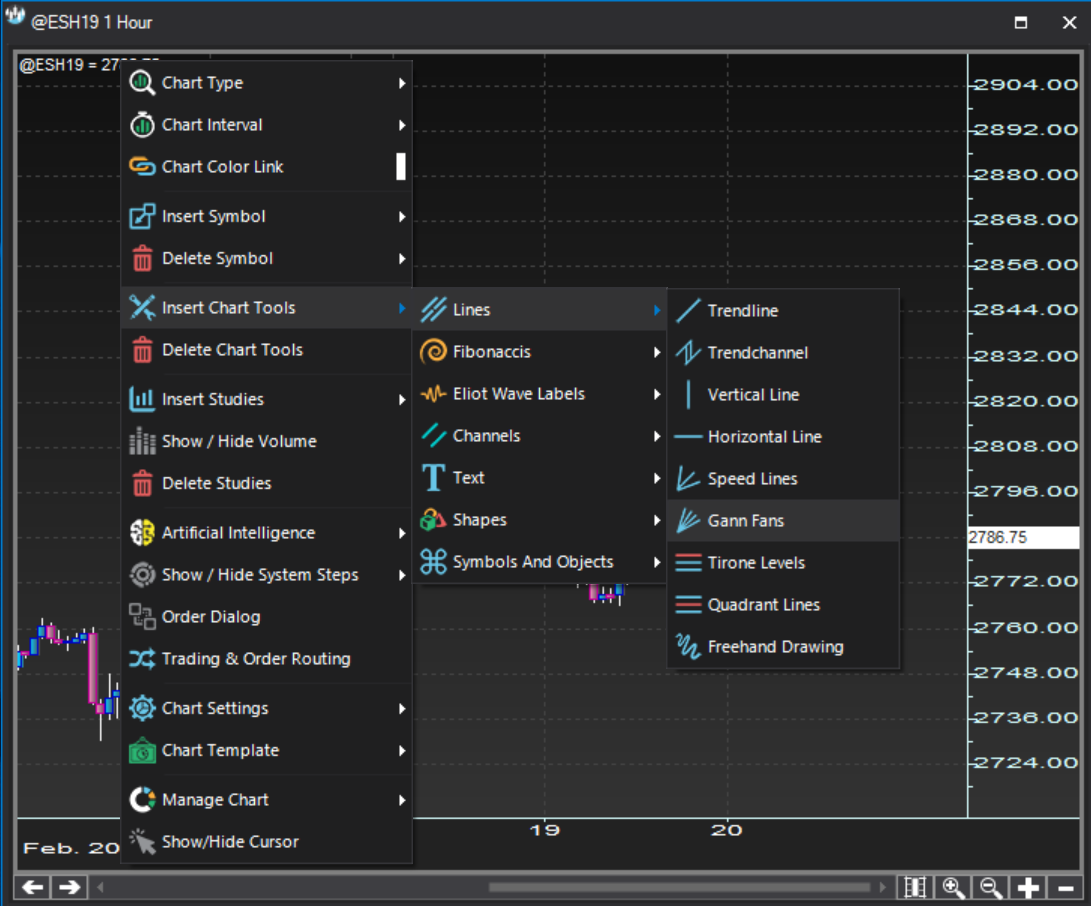
- Gann fansContext menu
Context menu Gann fans
Gann fans are available under the option:
Right click >> Insert chart tools >> Lines >> Gann Fans
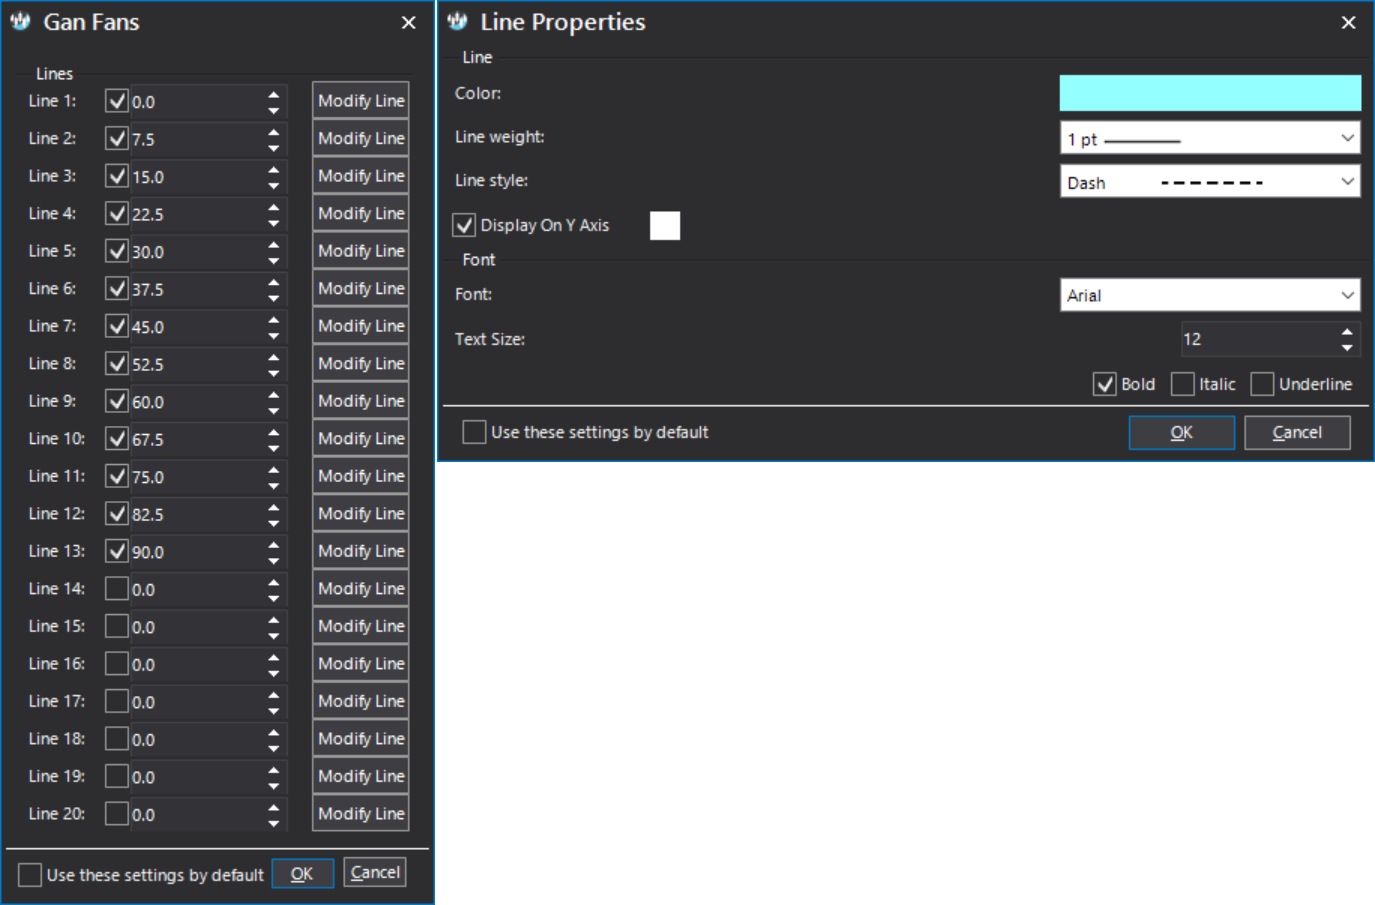
- Gann fansProperties dialog
Properties dialog Gann fans
The Gann Fans Properties dialog is a two stage dialog. You can first set which lines to show based on specific angles. Subsequently, you can customize each fan line look through the Line Properties dialog.
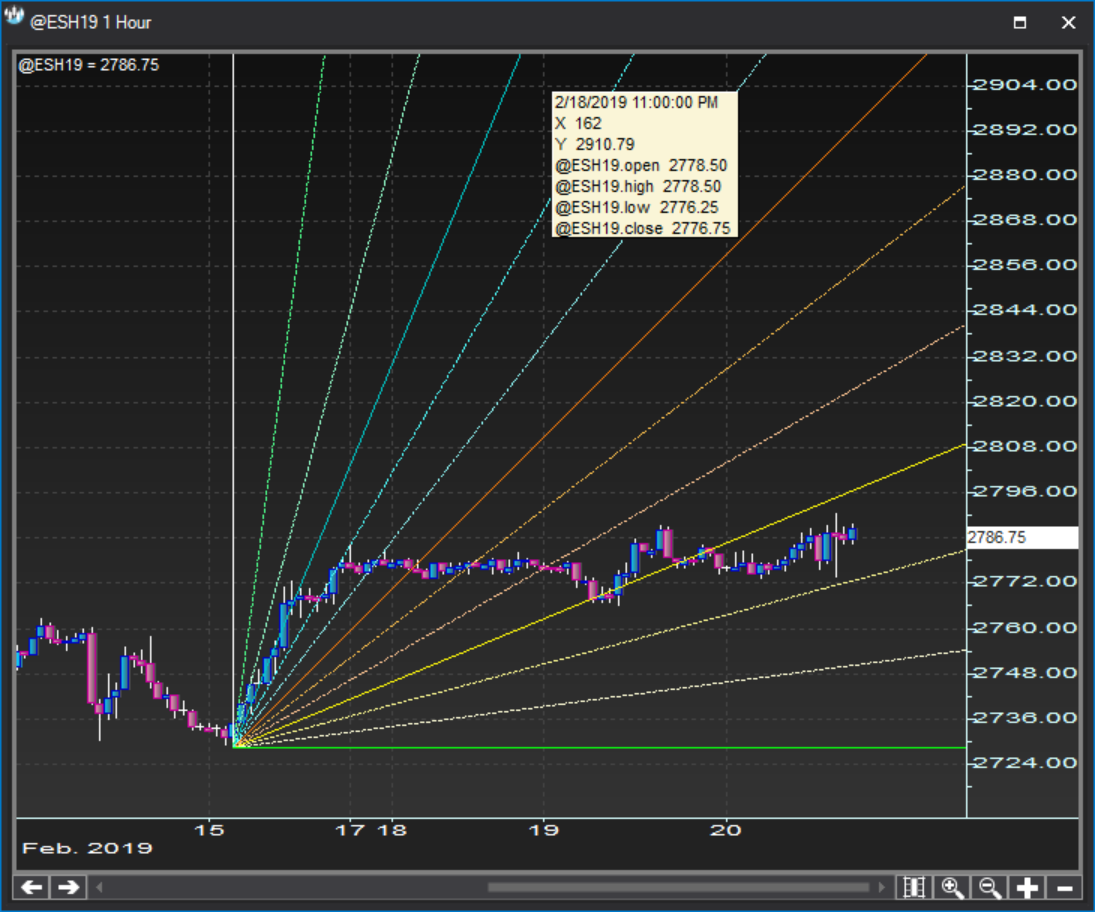
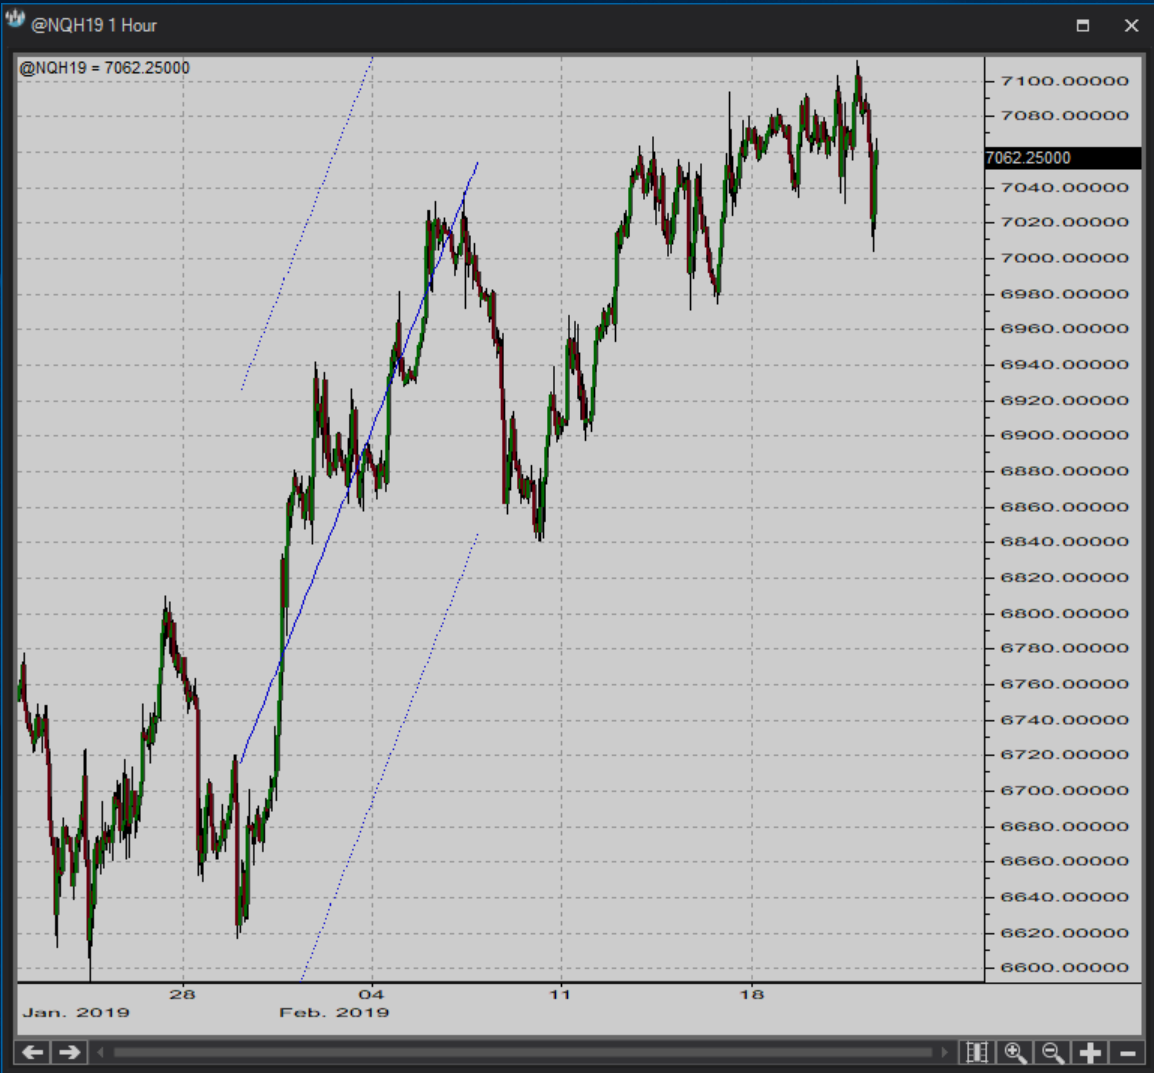
- Gann fansChart plot
Chart plot Gann fans
Shown below is an example of Gann fan lines drawn on a chart.
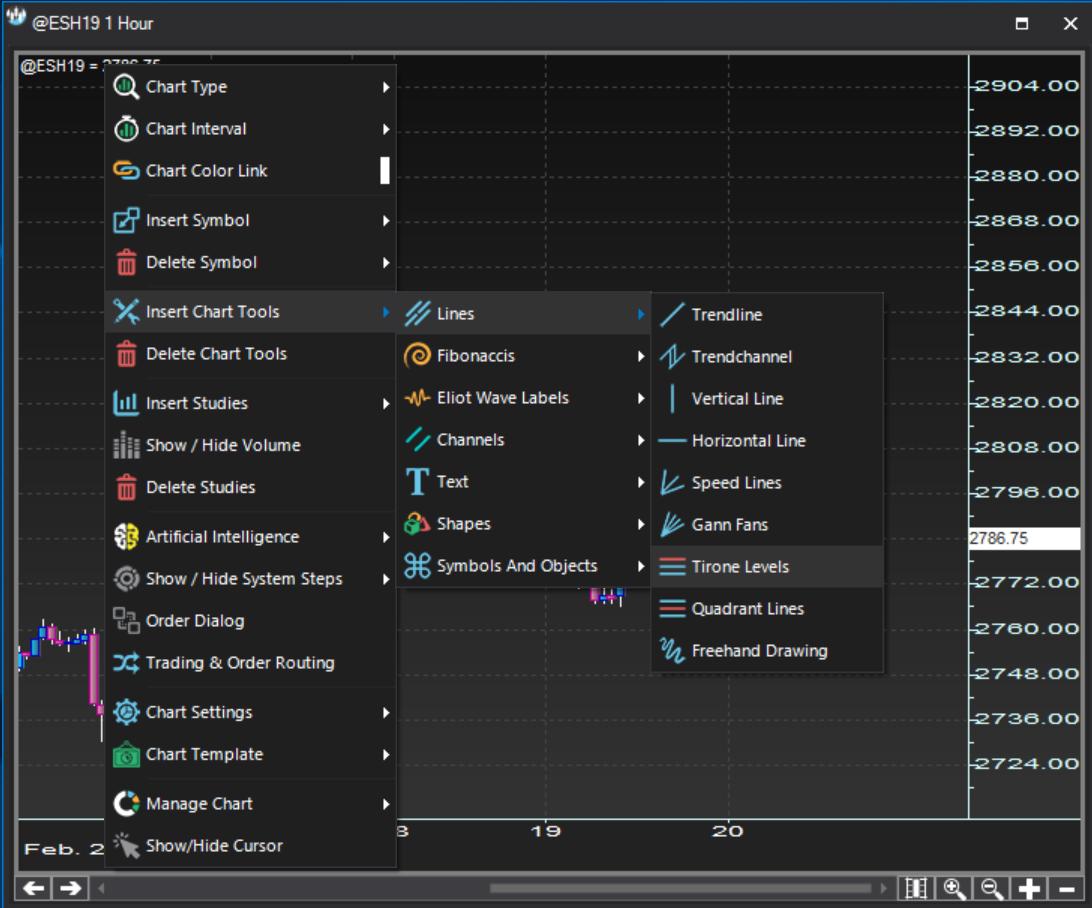
- Tirone levelsContext menu
Context menu Tirone levels
Tirone Levels are available under the option:
Right click >> Insert chart tools >> Lines >> Tirone Levels
- Tirone levelsProperties dialog
Properties dialog Tirone levels
There is no Tirone Levels Properties dialog.
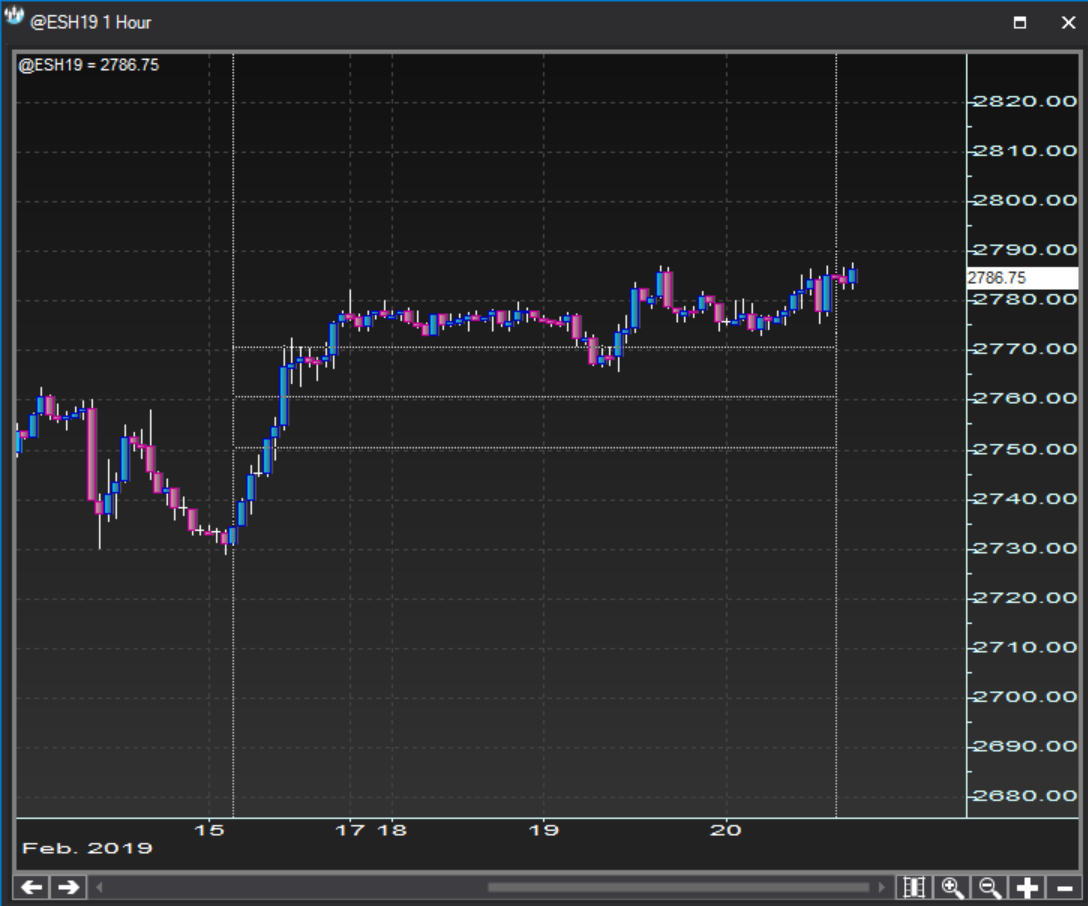
- Tirone levelsChart plot
Chart plot Tirone levels
Shown below is an example of a tirone levels drawn on a chart.
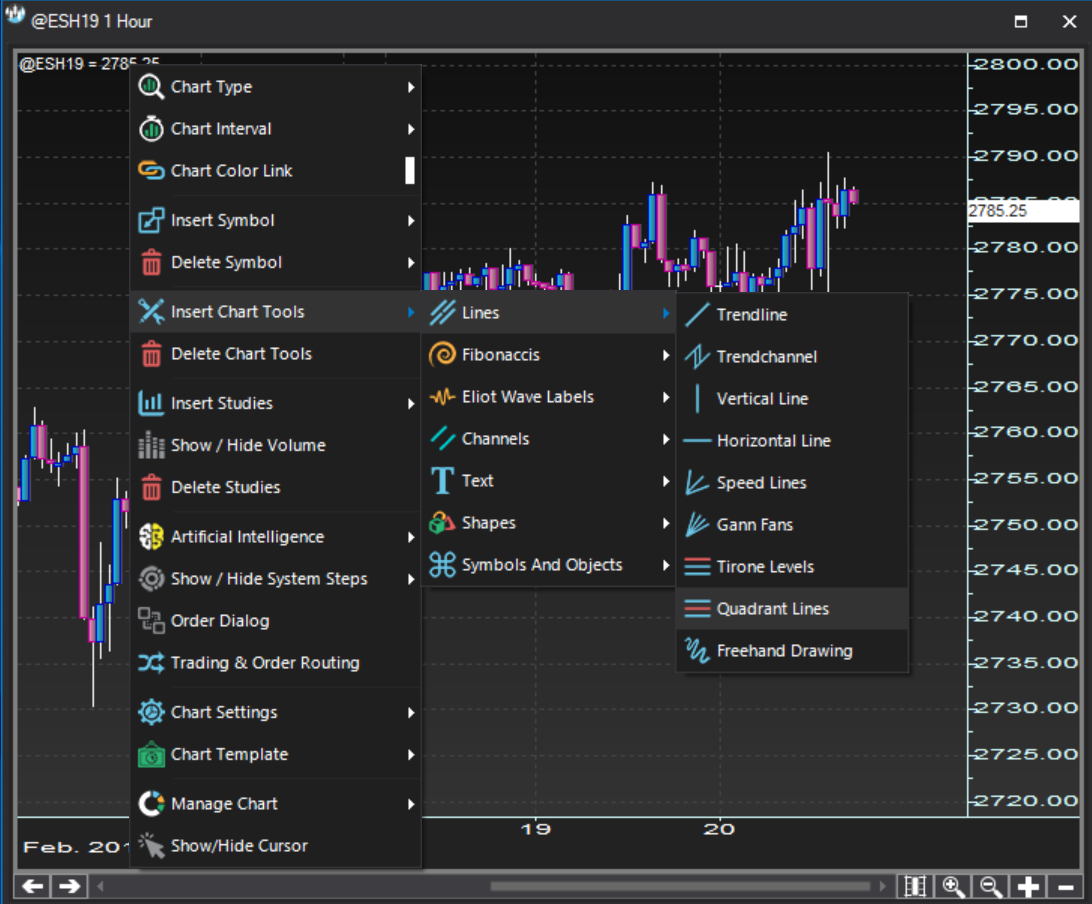
- Quadrant linesContext menu
Context menu Quadrant lines
Quadrant lines are available under the option:
Right click >> Insert chart tools >> Lines >> Quadrant Lines
- Quadrant linesProperties dialog
Properties dialog Quadrant lines
There is no Quadrant Lines Properties dialog.
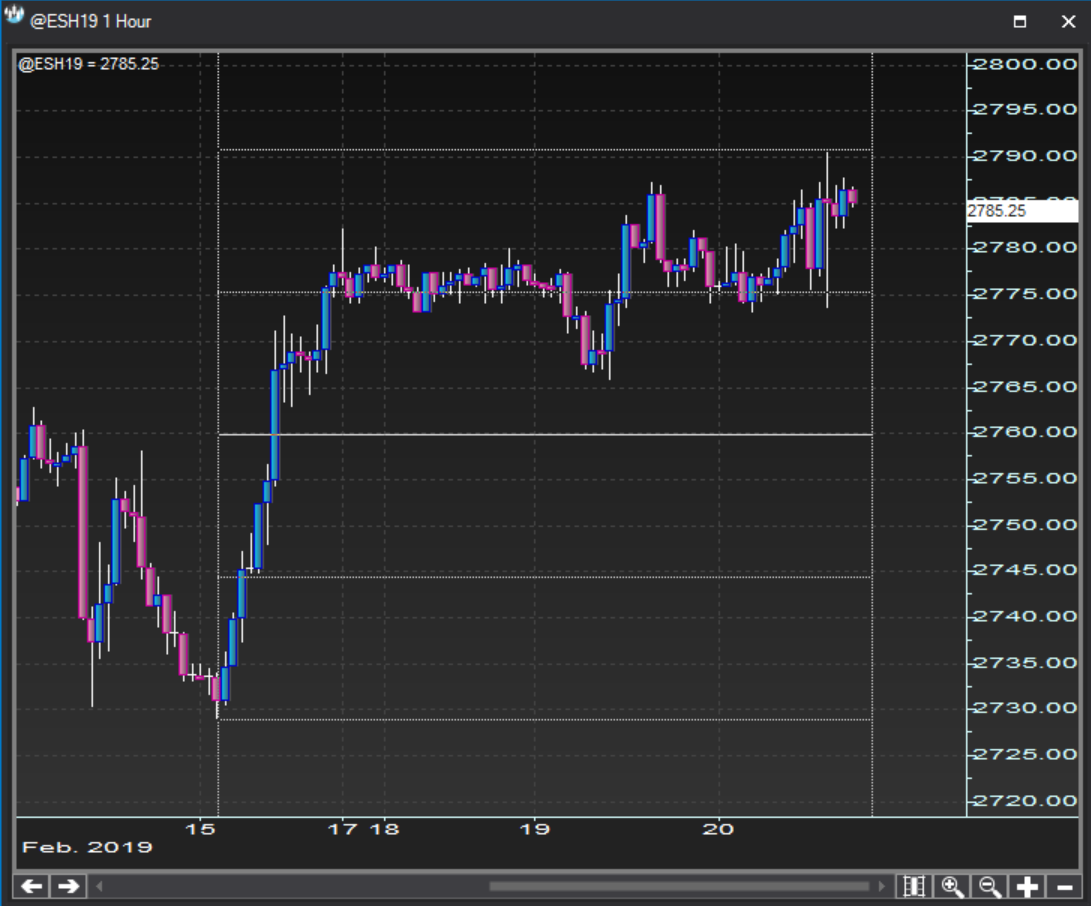
- Quadrant linesChart plot
Chart plot Quadrant lines
Shown below is an example of a quadrant lines drawn on a chart.
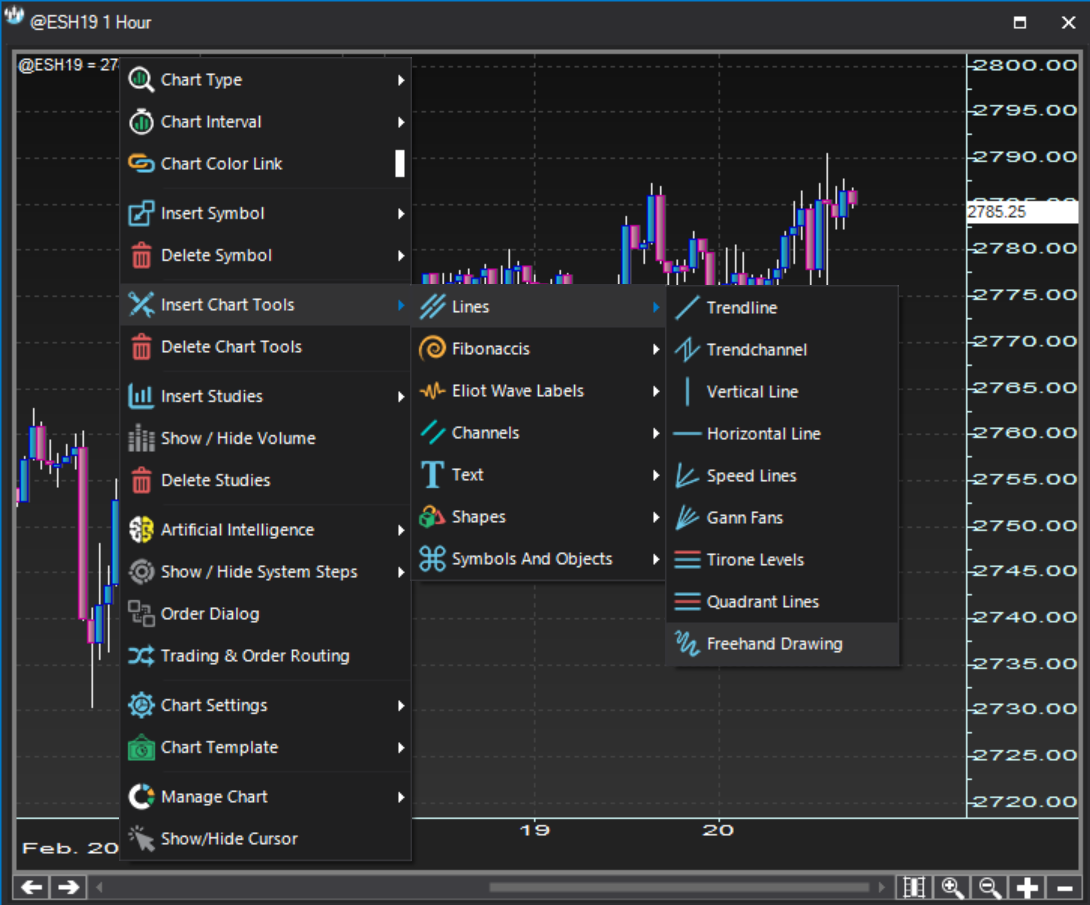
- Freehand drawingContext menu
Context menu Freehand drawing
Freehand drawings are available under the option:
Right click >> Insert chart tools >> Lines >> Freehand Drawing
- Freehand drawingProperties dialog
Properties dialog Freehand drawing
There is no Freehand Drawing Properties dialog.
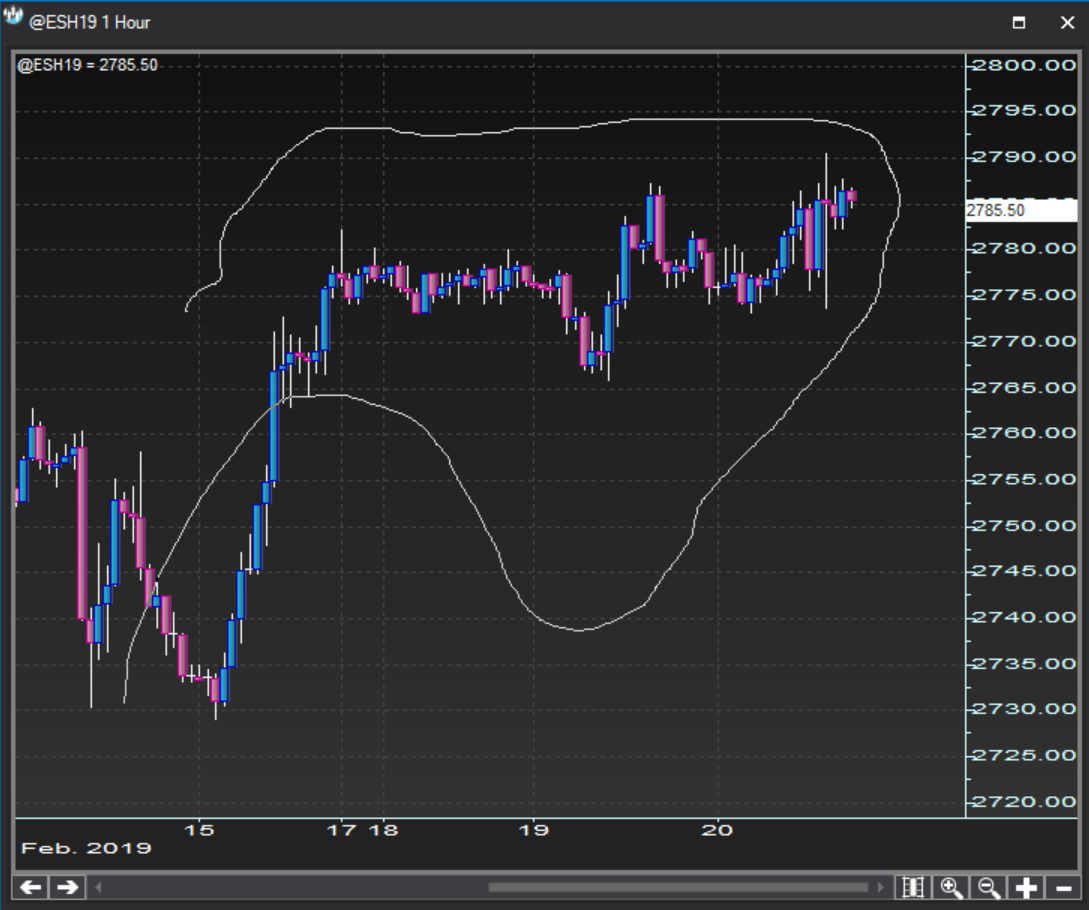
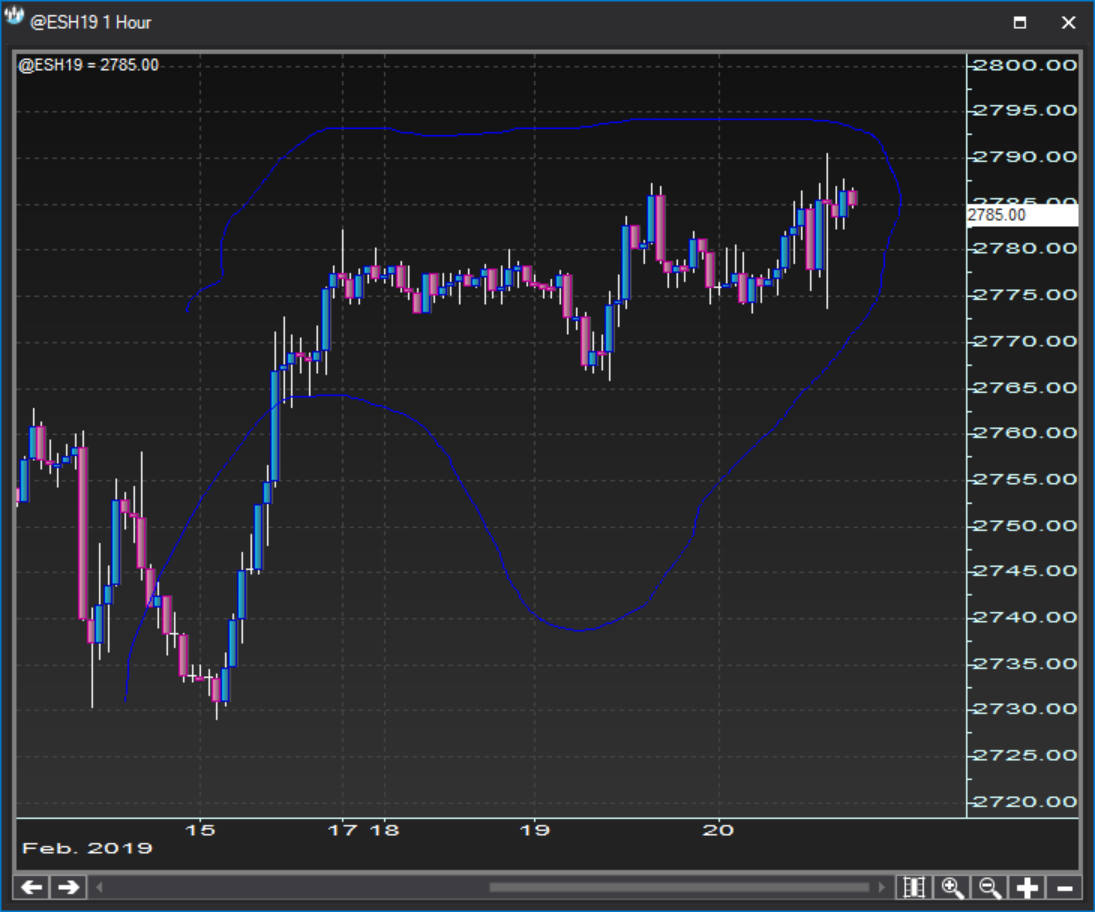
- Freehand drawingChart plot
Chart plot Freehand drawing
Shown below is an example of a freehand drawing drawn on a chart.
Fibonacci tools
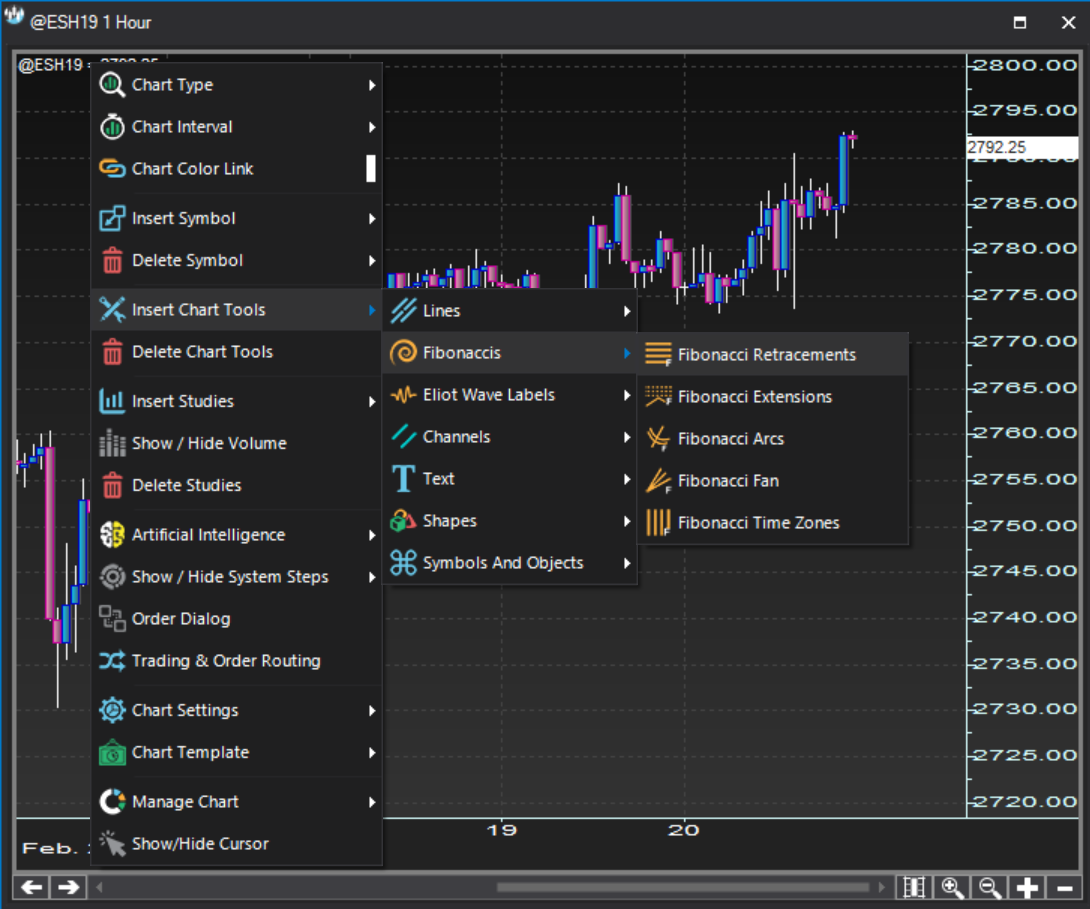
- Fibonacci retracementsContext menu
Context menu Fibonacci retracements
Fibonacci Retracements are available under the option:
Right click >> Insert chart tools >> Fibonaccis >> Fibonacci Retracements
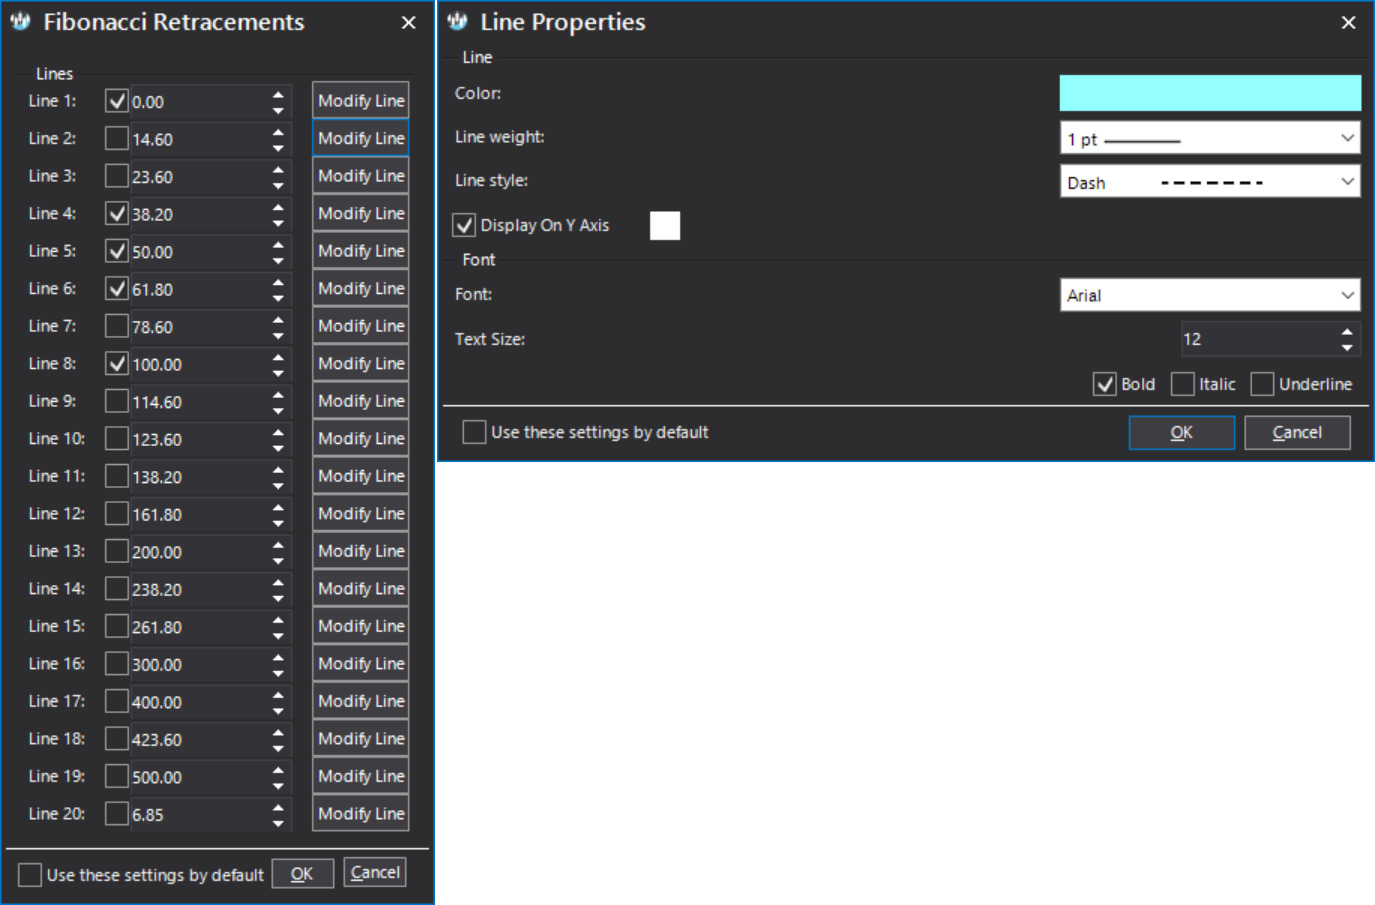
- Fibonacci retracementsProperties dialog
Properties dialog Fibonacci retracements
The Fibonacci Retracements Properties dialog is a two stage dialog. You can first set which lines to show based on specific percentage retracements. Subsequently, you can customize each retracement line look through the Line Properties dialog.
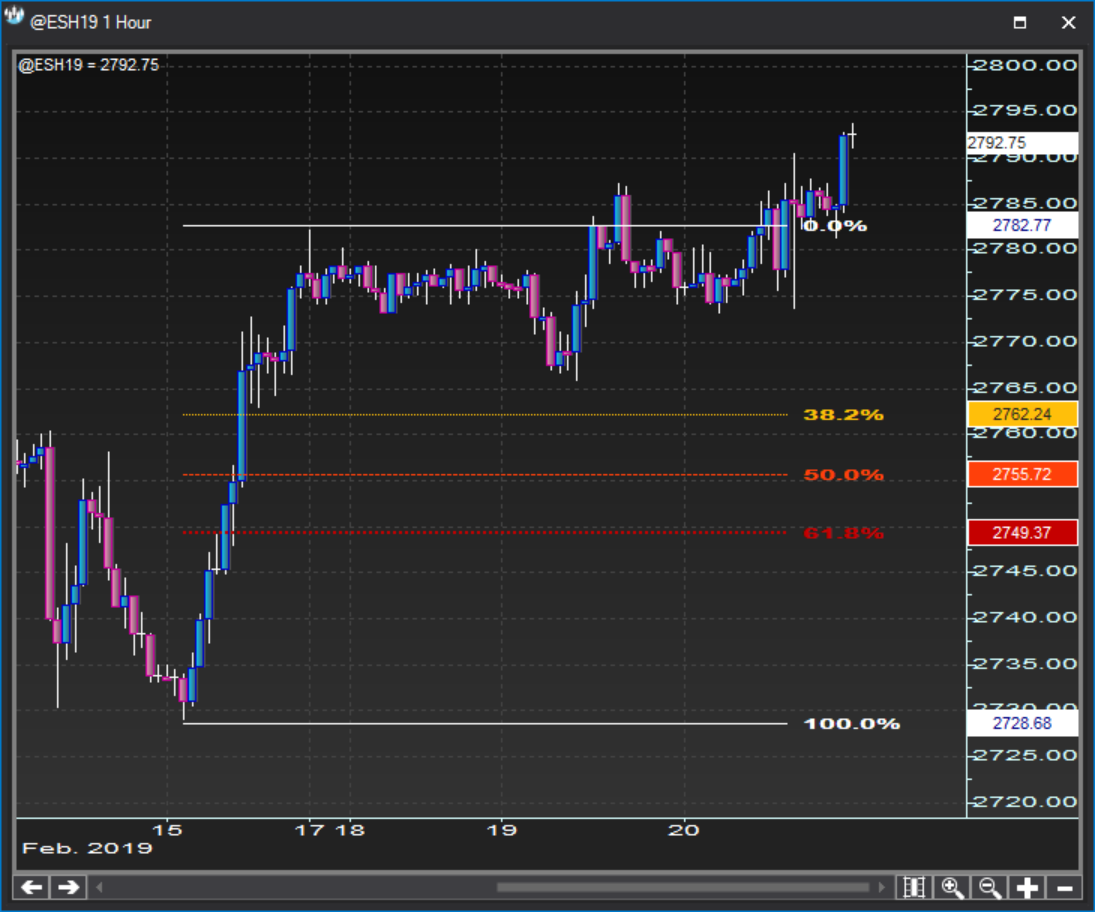
- Fibonacci retracementsChart plot
Chart plot Fibonacci retracements
Shown below is an example of fibonacci retracement lines drawn on a chart.
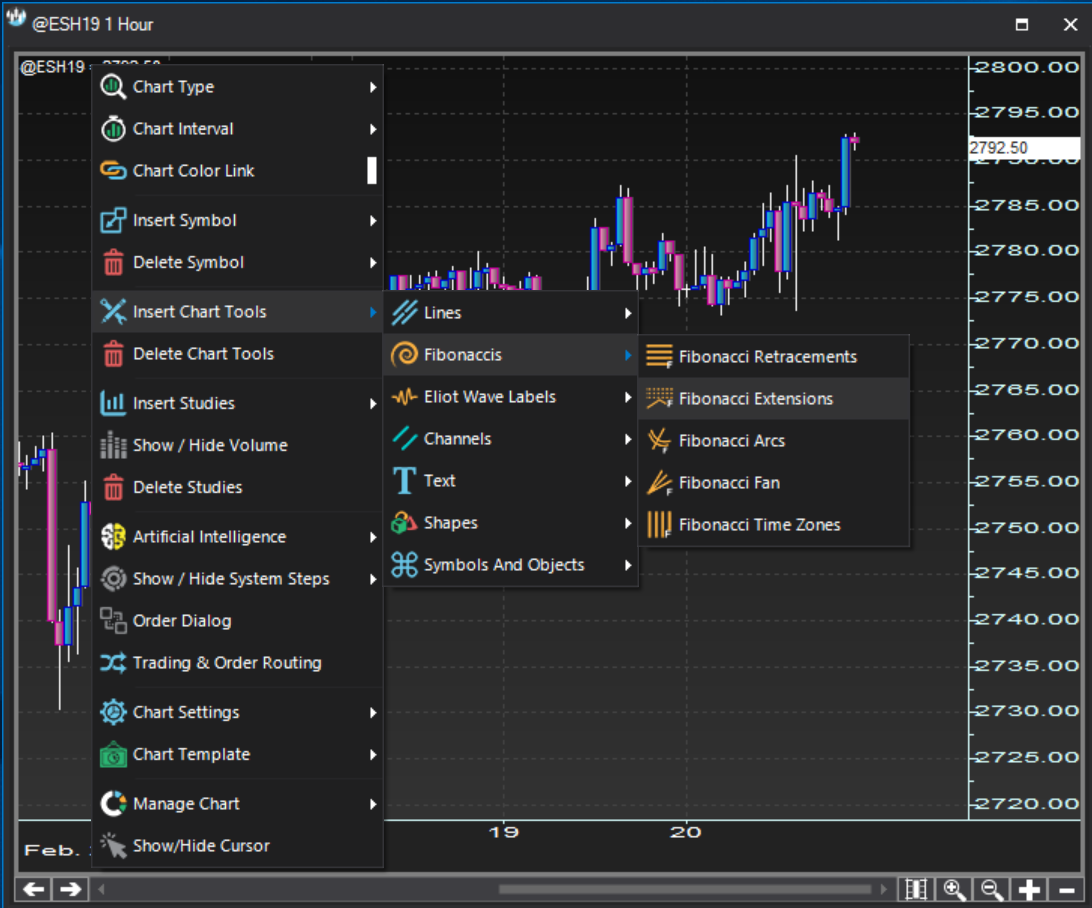
- Fibonacci extensionsContext menu
Context menu Fibonacci extensions
Fibonacci Extensions are available under the option:
Right click >> Insert chart tools >> Fibonaccis >> Fibonacci Extensions
- Fibonacci extensionsProperties dialog
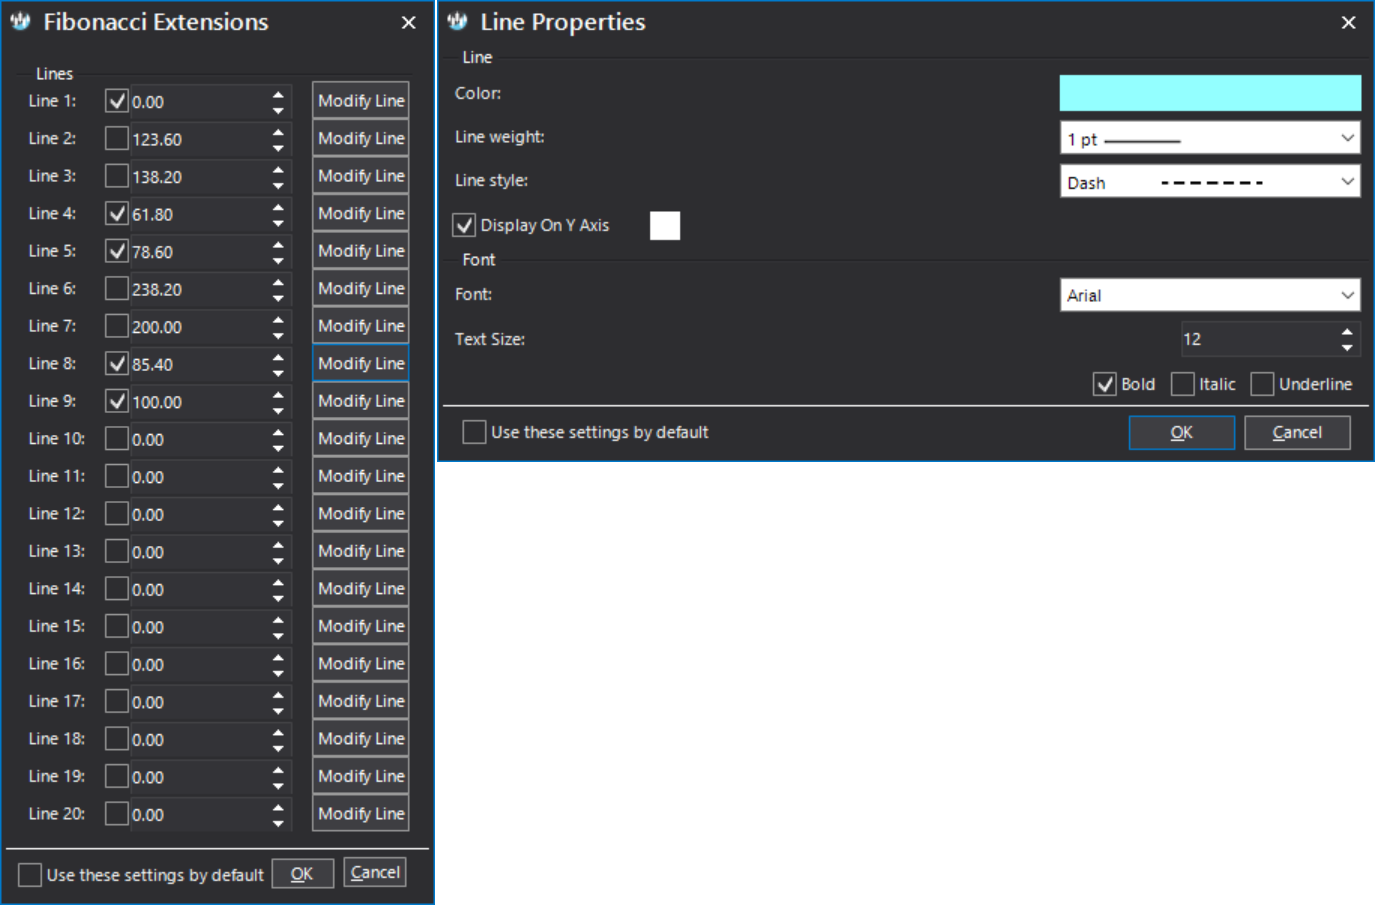
Properties dialog Fibonacci extensions
The Fibonacci Extensions Properties dialog is a two stage dialog. You can first set which lines to show based on specific percentage extensions. Subsequently, you can customize each extension line look through the Line Properties dialog.
- Fibonacci extensionsChart plot
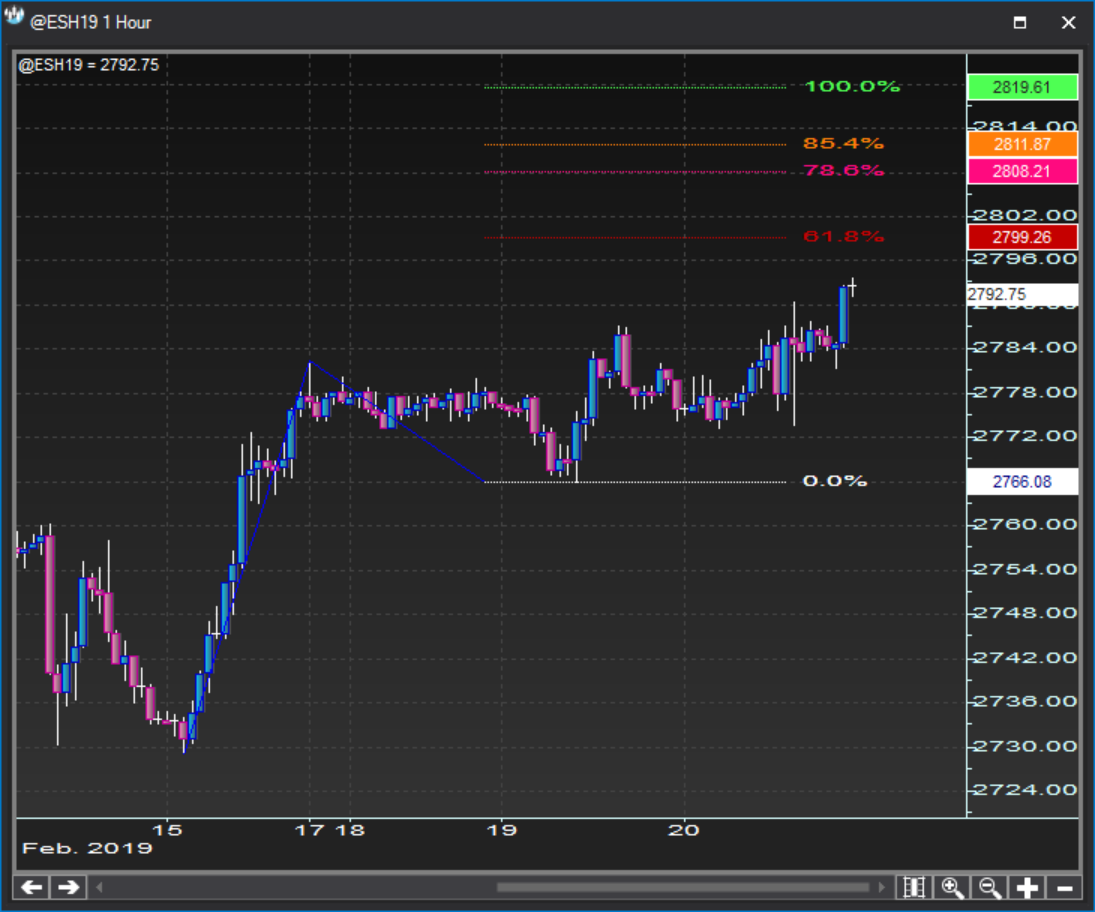
Chart plot Fibonacci extensions
Shown below is an example of fibonacci extension lines drawn on a chart.
- Fibonacci ArcsContext menu
Context menu Fibonacci Arcs
Fibonacci Arcs are available under the option:
Right click >> Insert chart tools >> Fibonaccis >> Fibonacci Arcs

- Fibonacci ArcsProperties dialog
Properties dialog Fibonacci Arcs
There is no Fibonacci Arcs Properties dialog.
- Fibonacci ArcsChart plot
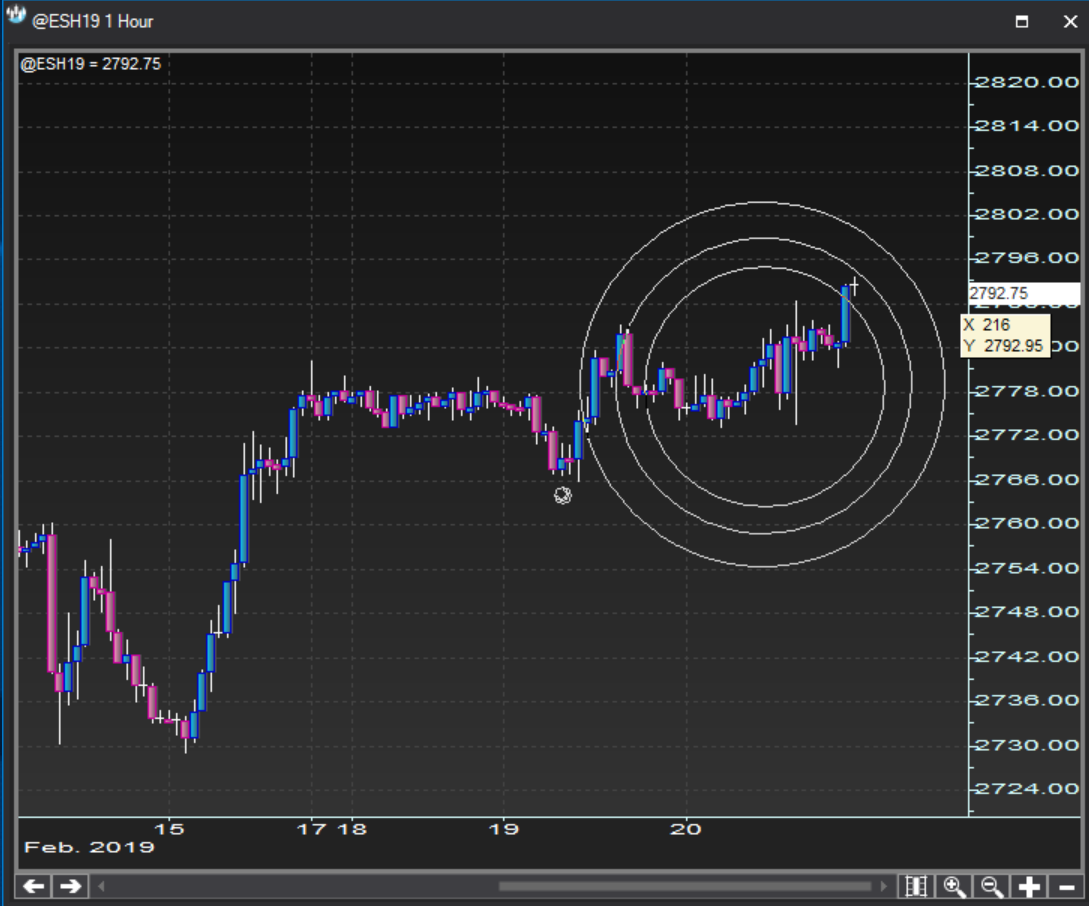
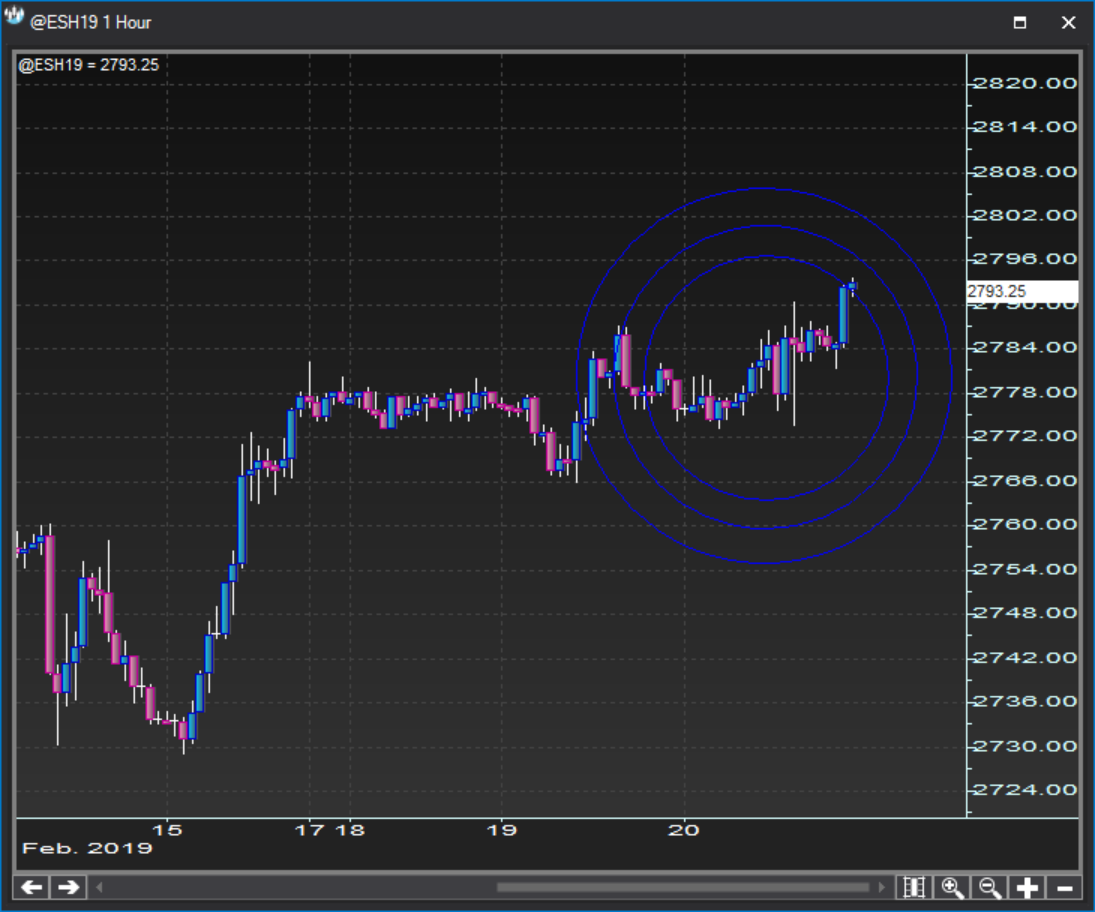
Chart plot Fibonacci Arcs
Shown below is an example of fibonacci arcs drawn on a chart.
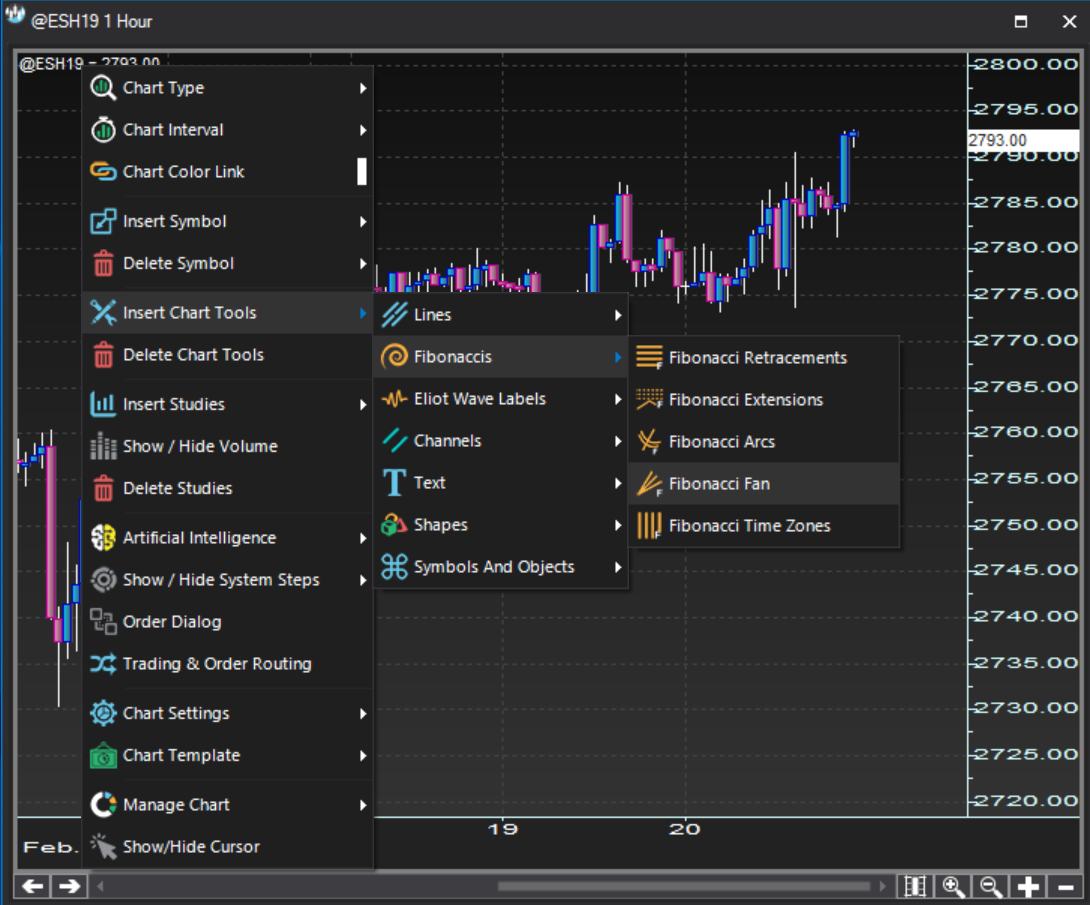
- Fibonacci FansContext menu
Context menu Fibonacci Fans
Fibonacci Fans are available under the option:
Right click >> Insert chart tools >> Fibonaccis >> Fibonacci Fan
- Fibonacci FansProperties dialog
Properties dialog Fibonacci Fans
There is no Fibonacci Fan Properties dialog.
- Fibonacci FansChart plot
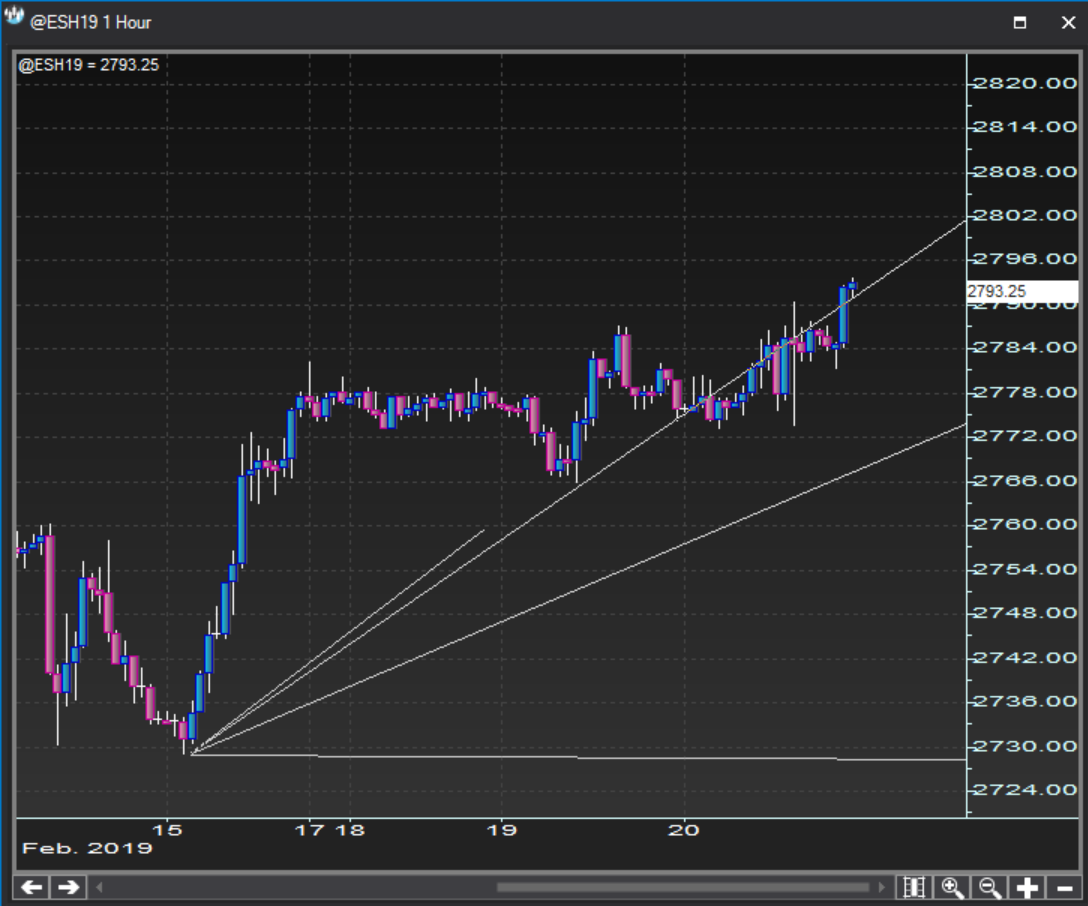
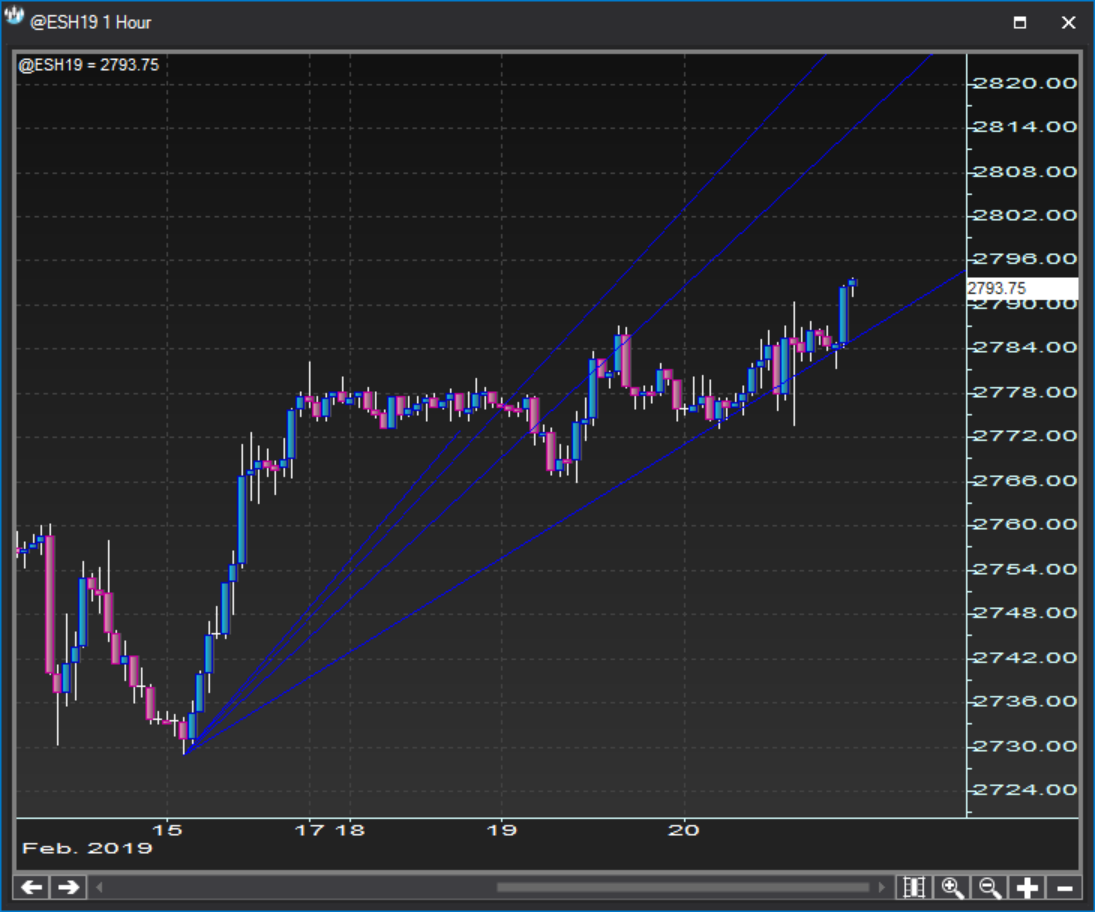
Chart plot Fibonacci Fans
Shown below is an example of fibonacci fan lines drawn on a chart.
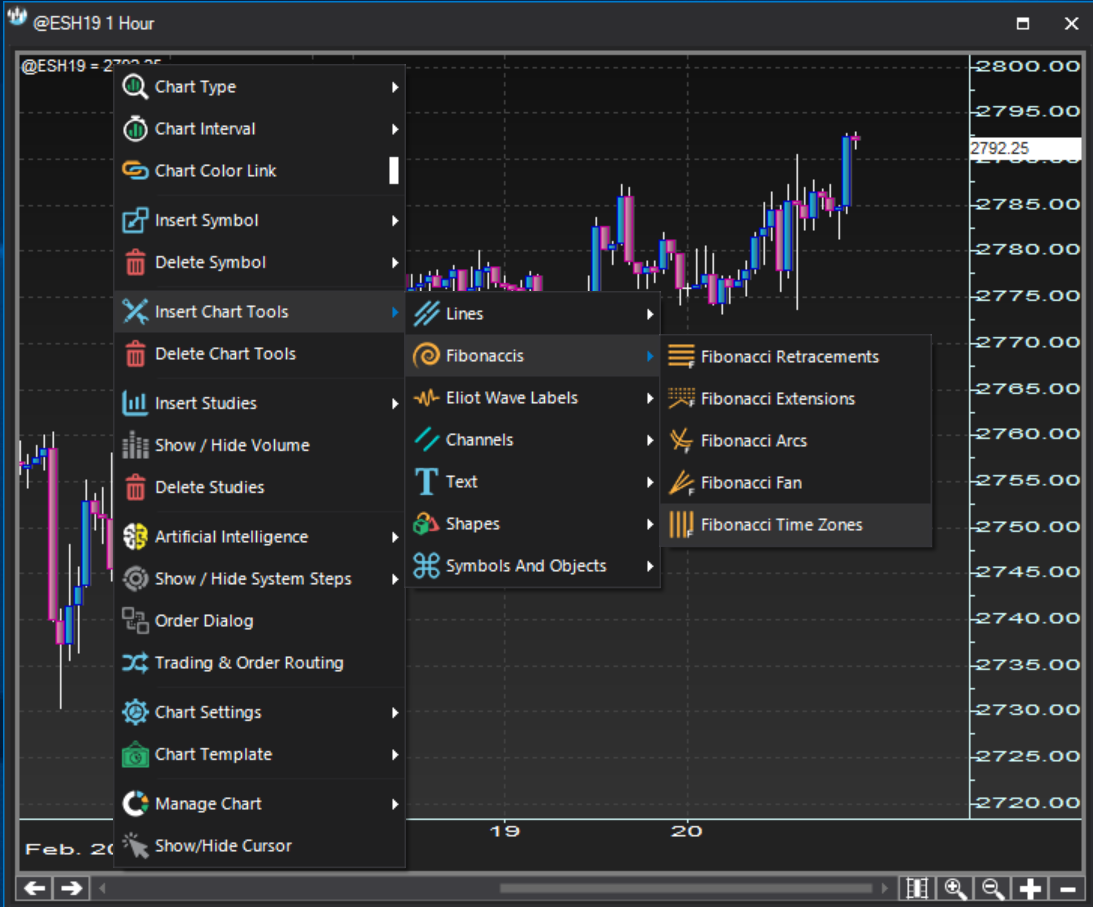
- Fibonacci Time ZonesContext menu
Context menu Fibonacci Time Zones
Fibonacci Time Zones are available under the option:
Right click >> Insert chart tools >> Fibonaccis >> Fibonacci Time Zones
- Fibonacci Time ZonesProperties dialog
Properties dialog Fibonacci Time Zones
There is no Fibonacci Time Zones Properties dialog.
- Fibonacci Time ZonesChart plot
Chart plot Fibonacci Time Zones
Shown below is an example of fibonacci time zone lines drawn on a chart.
Elliott Wave labels
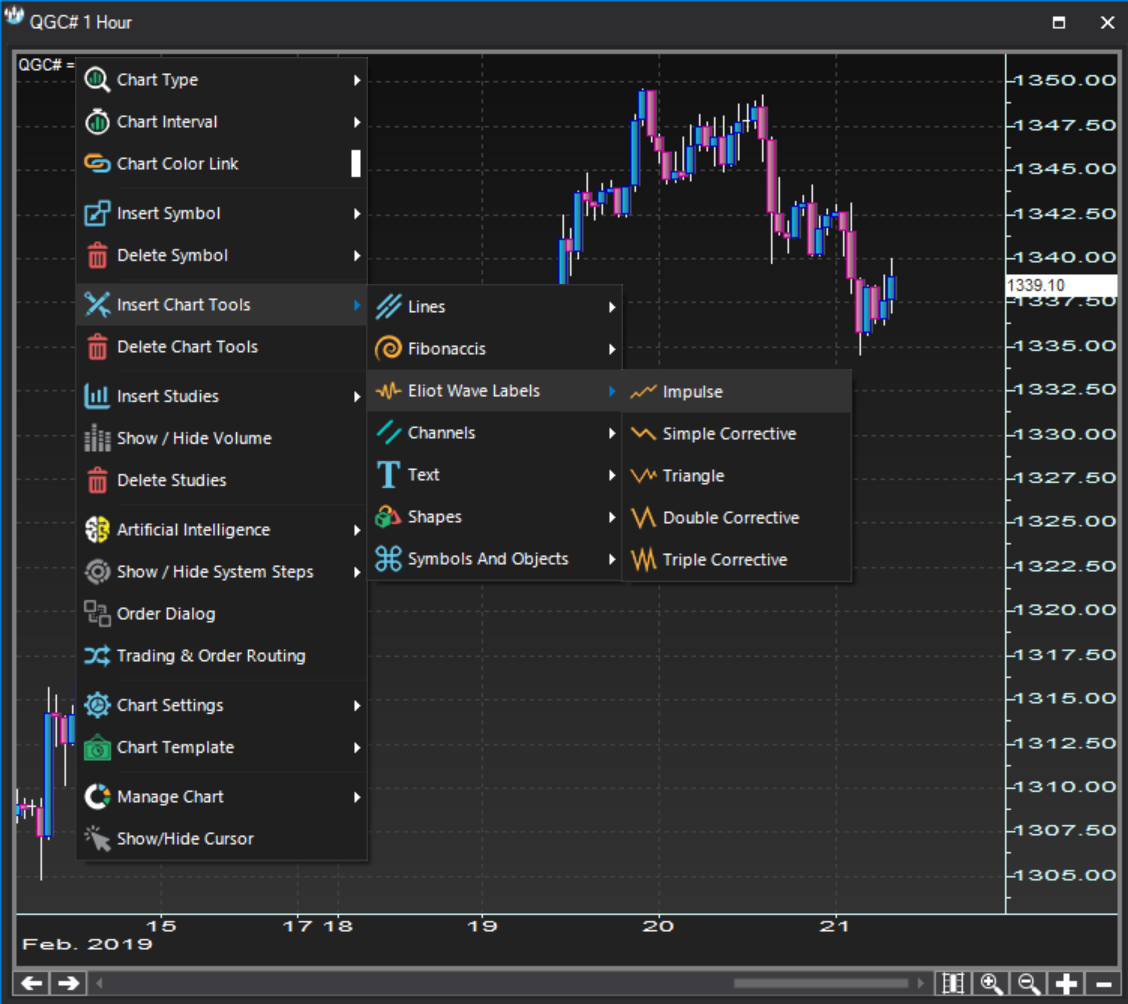
- Impulse patternContext menu
Context menu Impulse pattern
Impulse pattern labels (1-2-3-4-5) can be created under the option:
Right click >> Insert chart tools >> Elliott Wave Labels >> Impulse
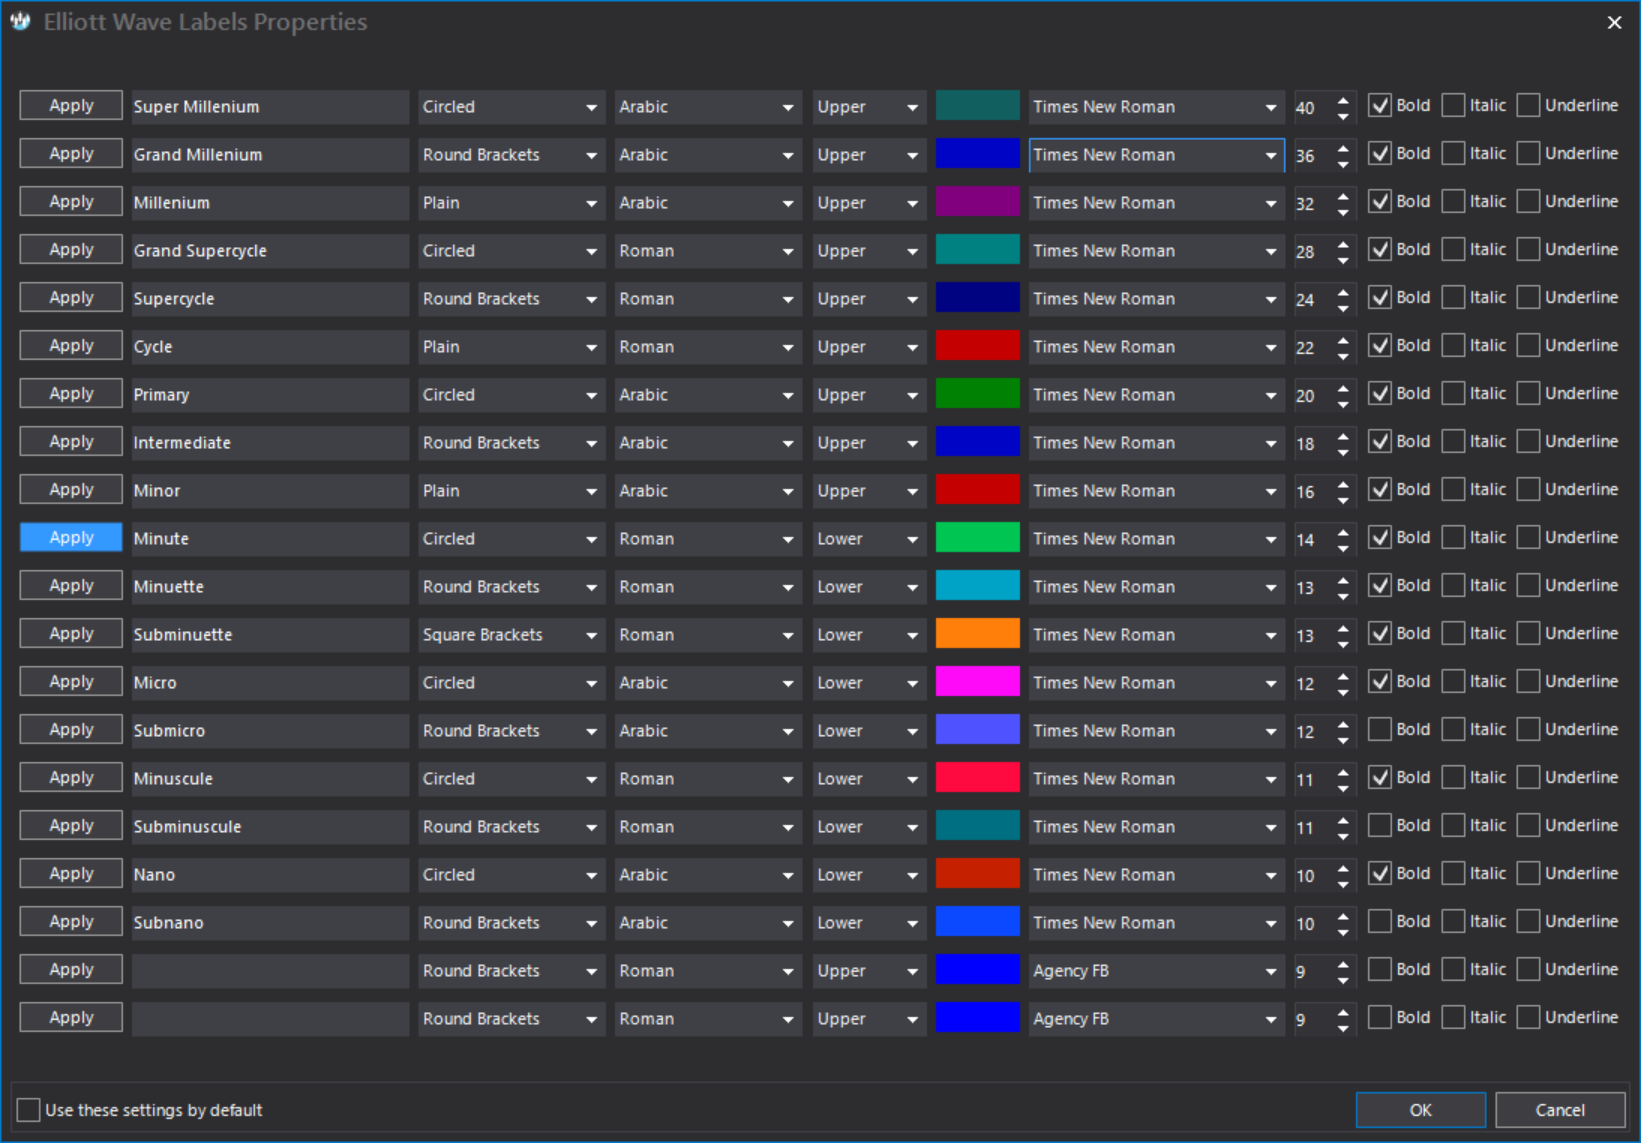
- Impulse patternProperties dialog
Properties dialog Impulse pattern
- Impulse patternChart plot
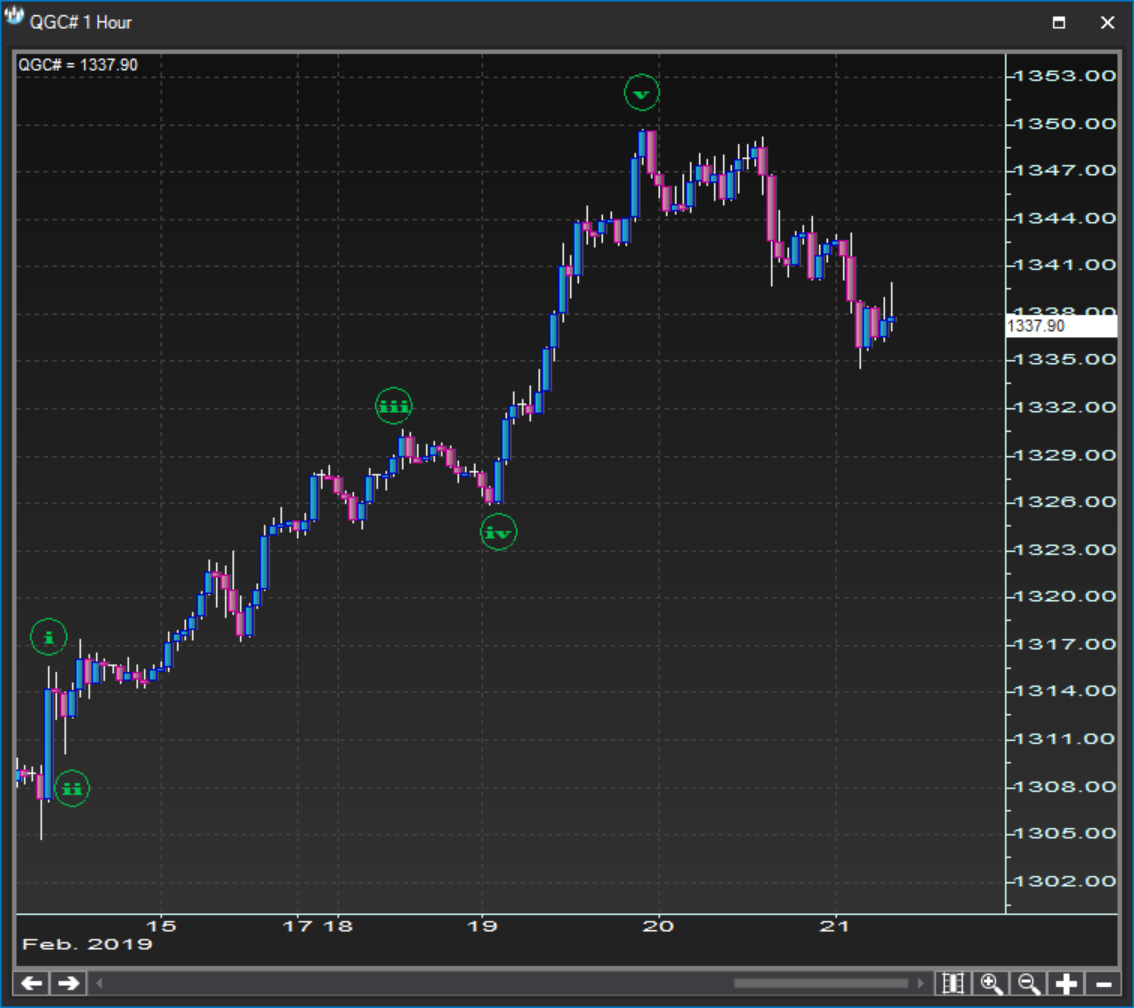
Chart plot Impulse pattern
Shown below is an example of impulse pattern labels drawn on a chart.
- Simple corrective patternContext menu
Context menu Simple corrective pattern
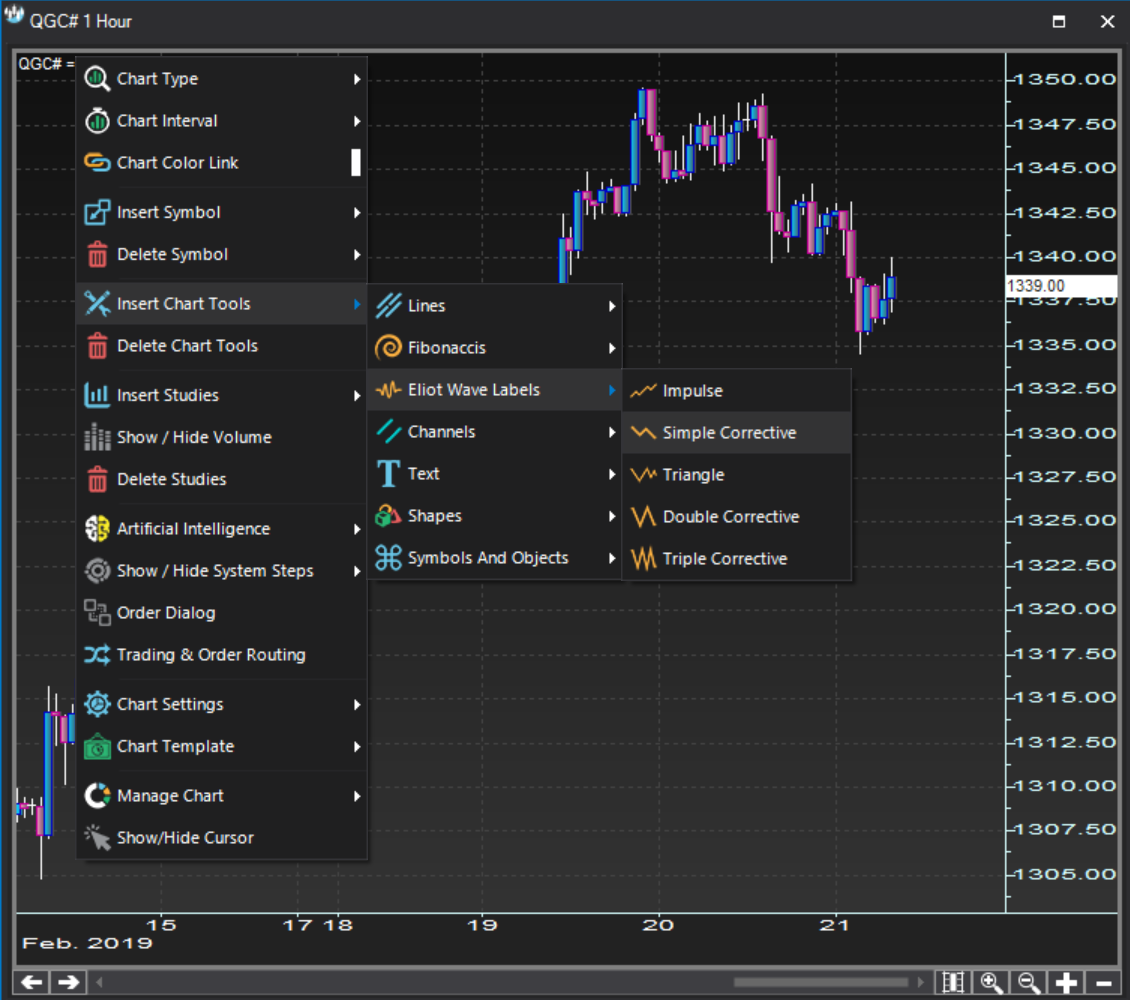
Simple corrective pattern labels (a-b-c) can be created under the option:
Right click >> Insert chart tools >> Elliott Wave Labels >> Simple Corrective
- Simple corrective patternProperties dialog
Properties dialog Simple corrective pattern
- Simple corrective patternChart plot
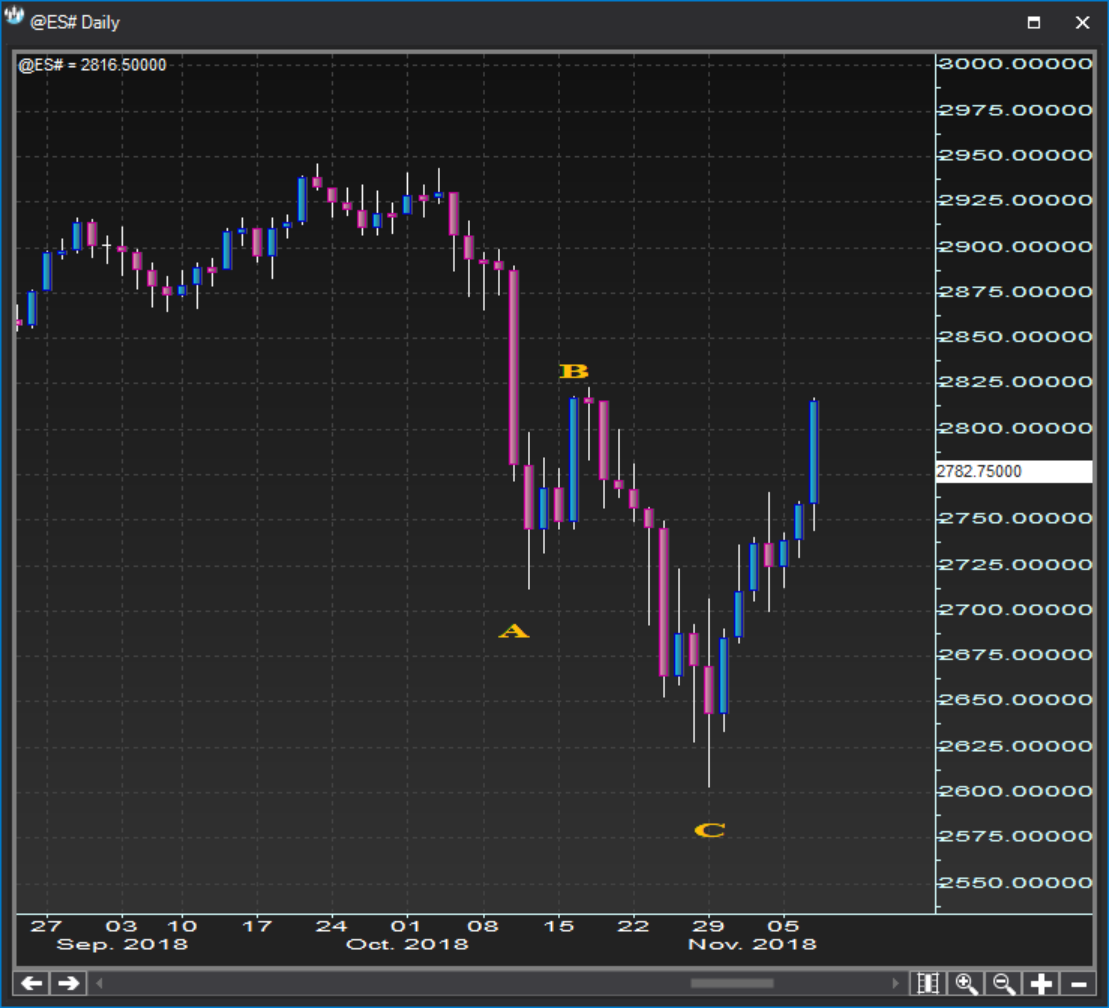
Chart plot Simple corrective pattern
Shown below is an example of simple corrective pattern labels drawn on a chart.
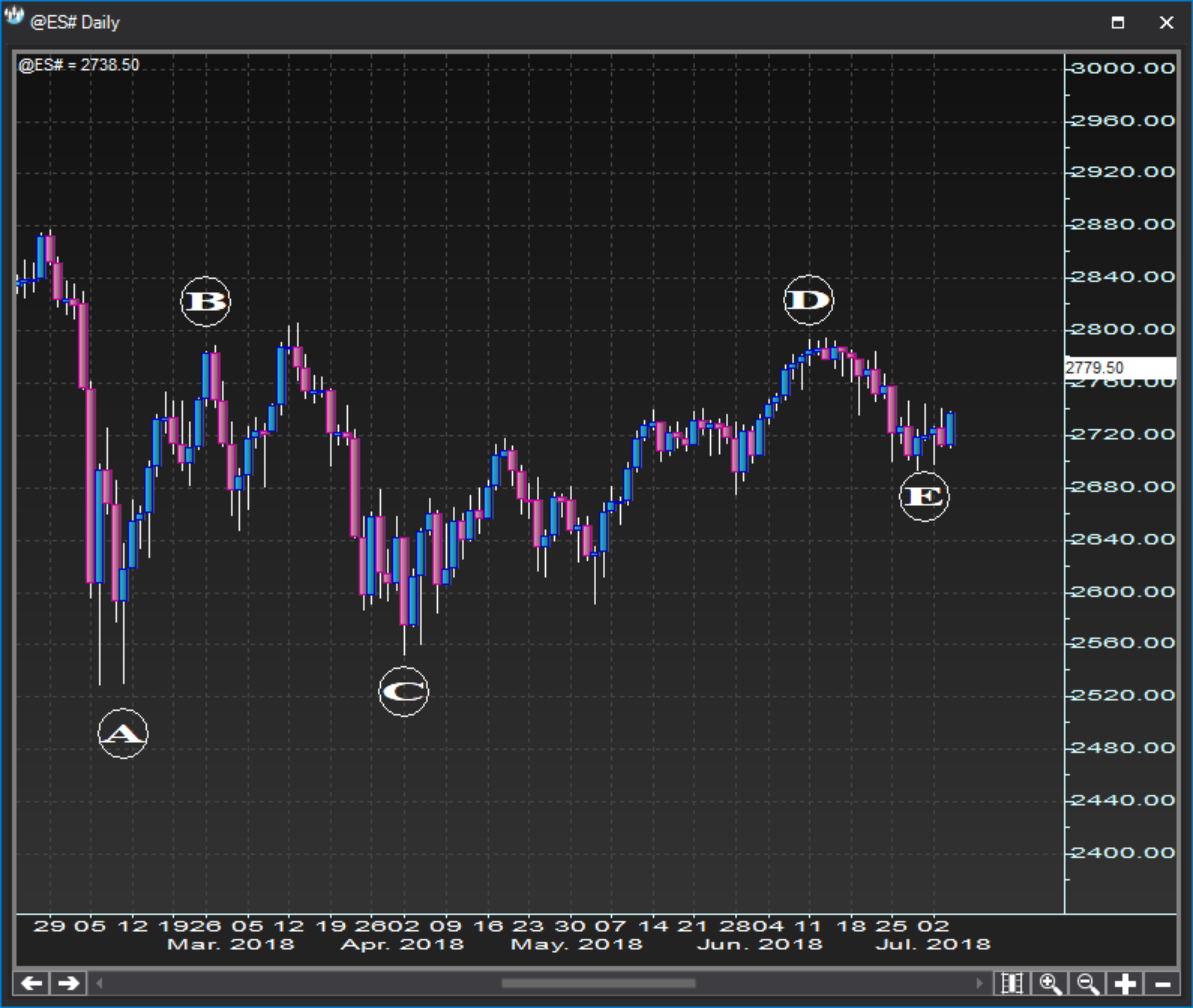
- Triangle patternContext menu
Context menu Triangle pattern
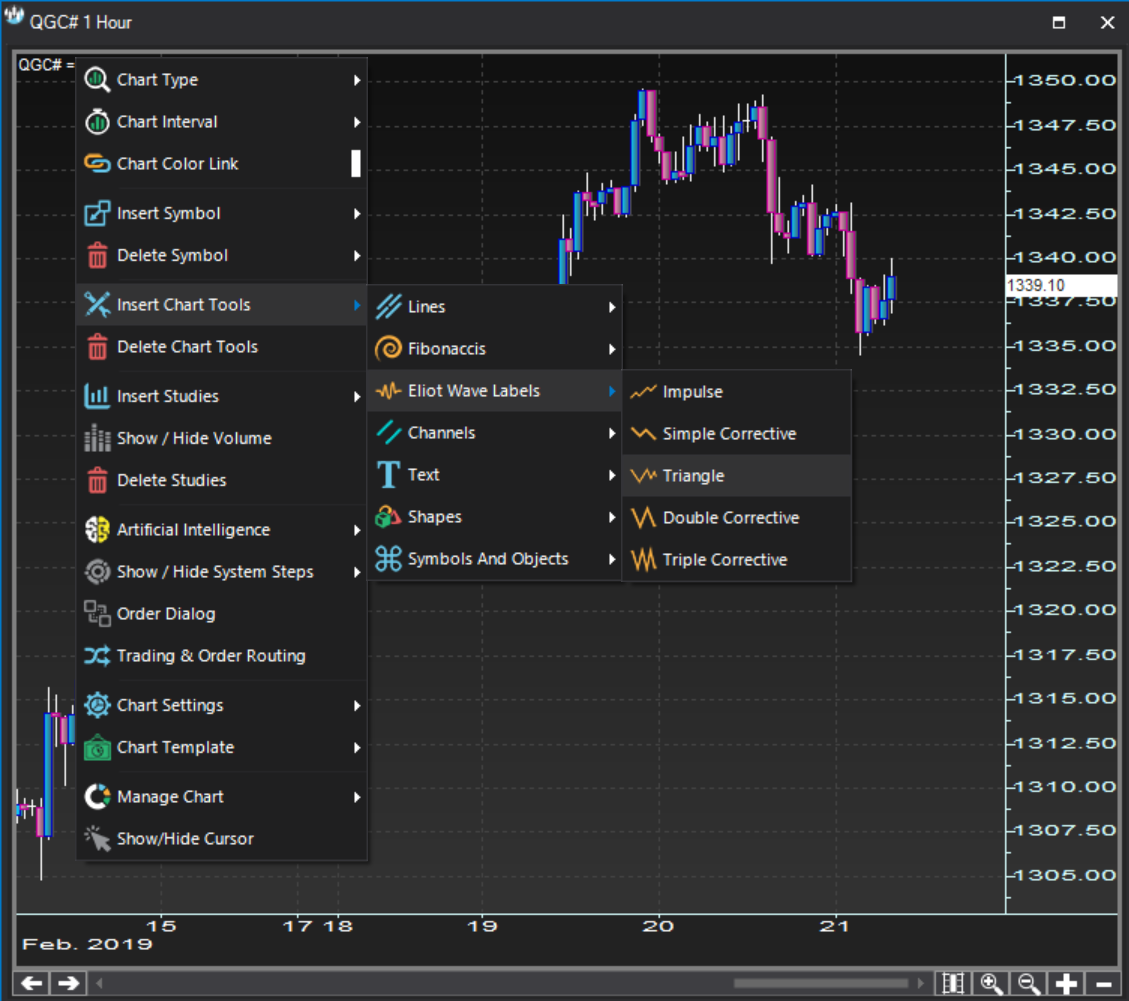
Triangle pattern labels (a-b-c-d-e) can be created under the option:
Right click >> Insert chart tools >> Elliott Wave Labels >> Triangle
- Triangle patternProperties dialog
Properties dialog Triangle pattern
- Triangle patternChart plot
Chart plot Triangle pattern
Shown below is an example of triangle pattern labels drawn on a chart.
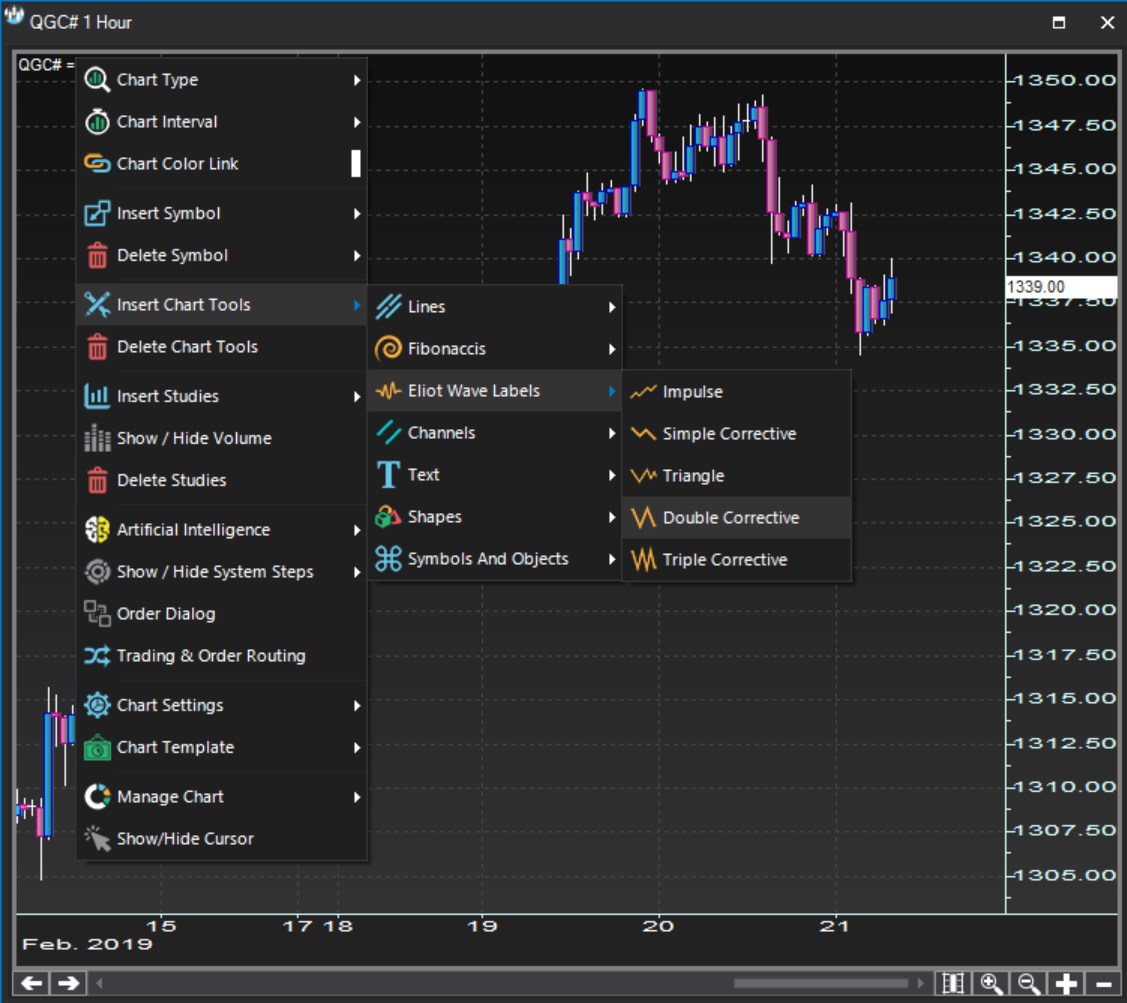
- Double corrective patternContext menu
Context menu Double corrective pattern
Double corrective pattern labels (w-x-y) can be created under the option:
Right click >> Insert chart tools >> Elliott Wave Labels >> Double Corrective
- Double corrective patternProperties dialog
Properties dialog Double corrective pattern
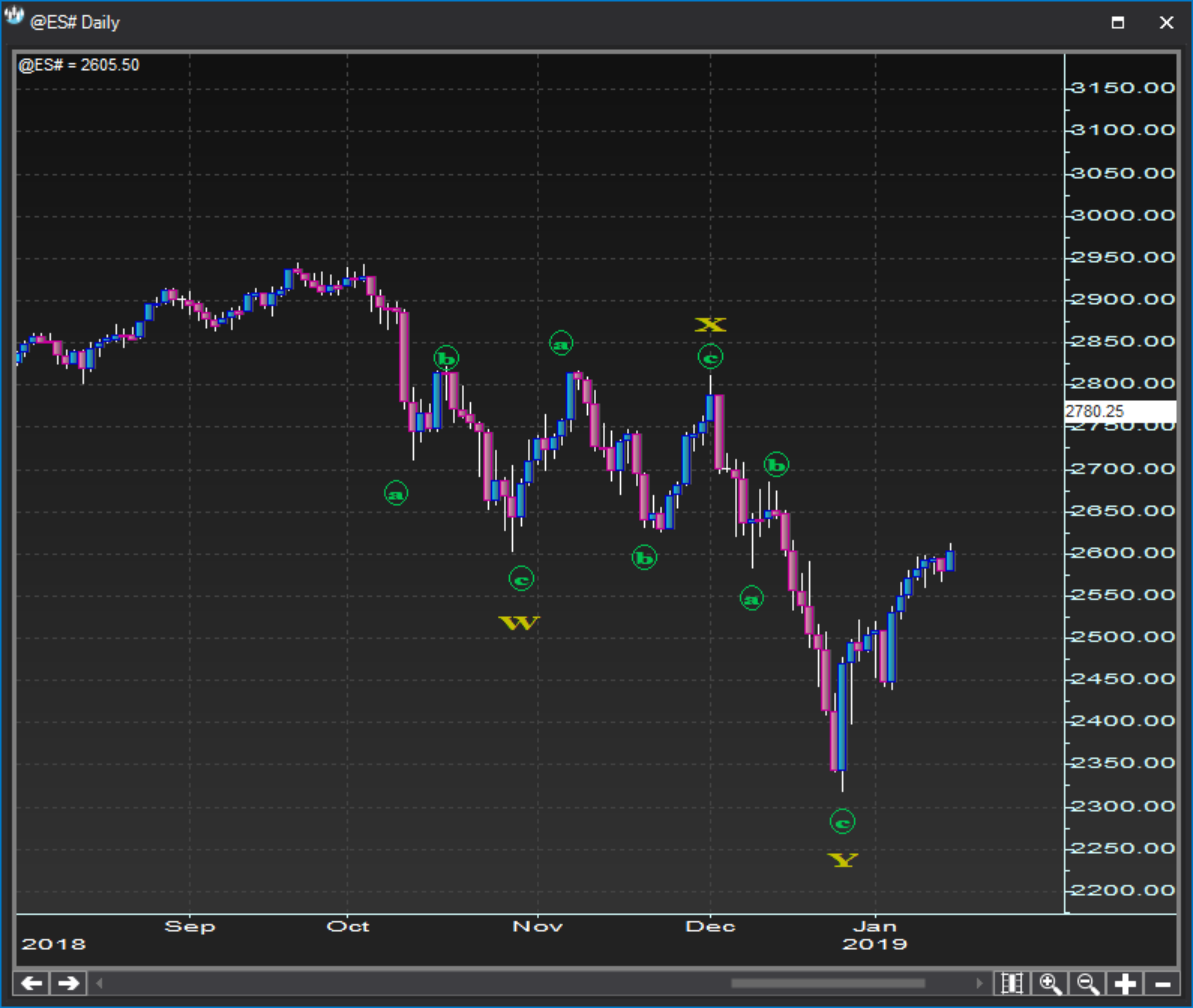
- Double corrective patternChart plot
Chart plot Double corrective pattern
Shown below is an example of double corrective pattern labels drawn on a chart.
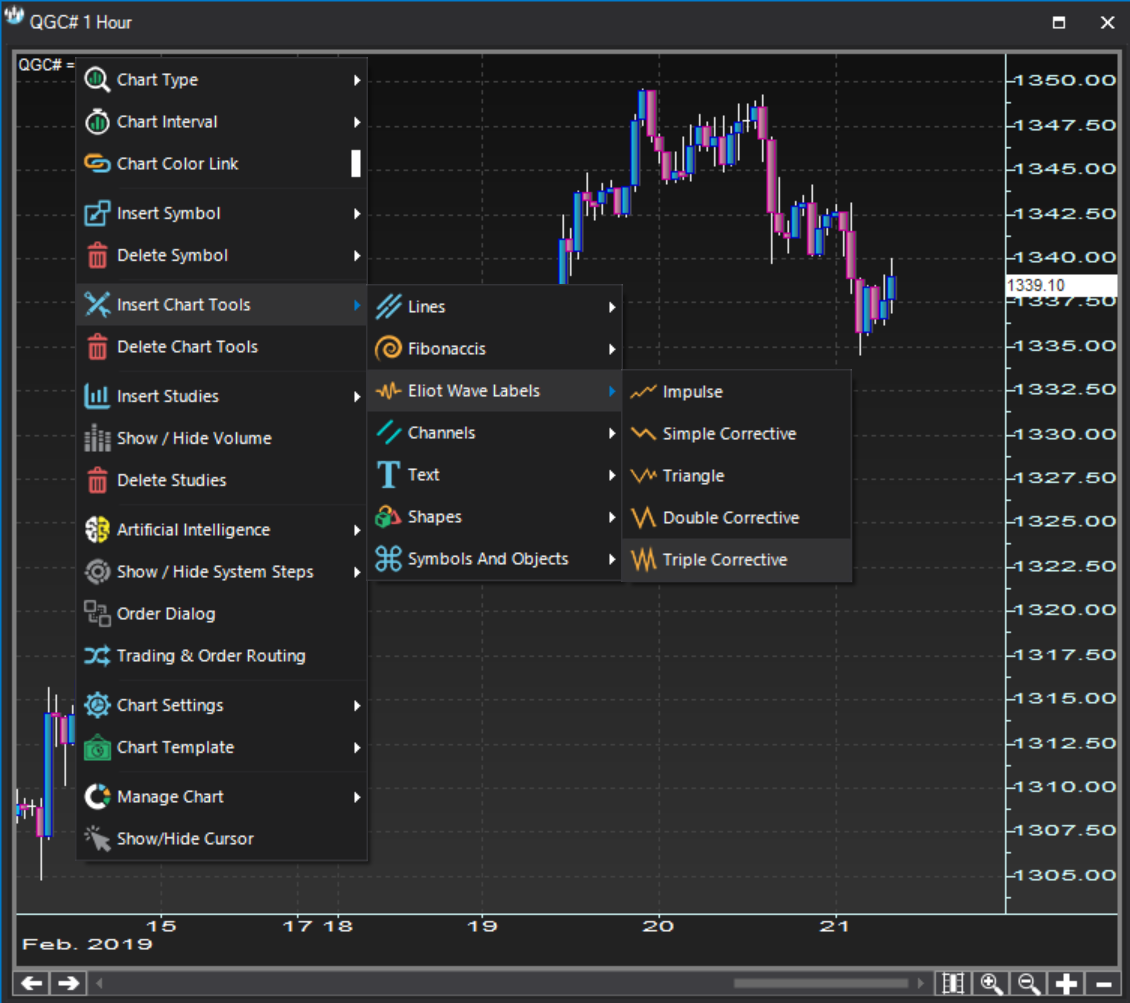
- Triple corrective patternContext menu
Context menu Triple corrective pattern
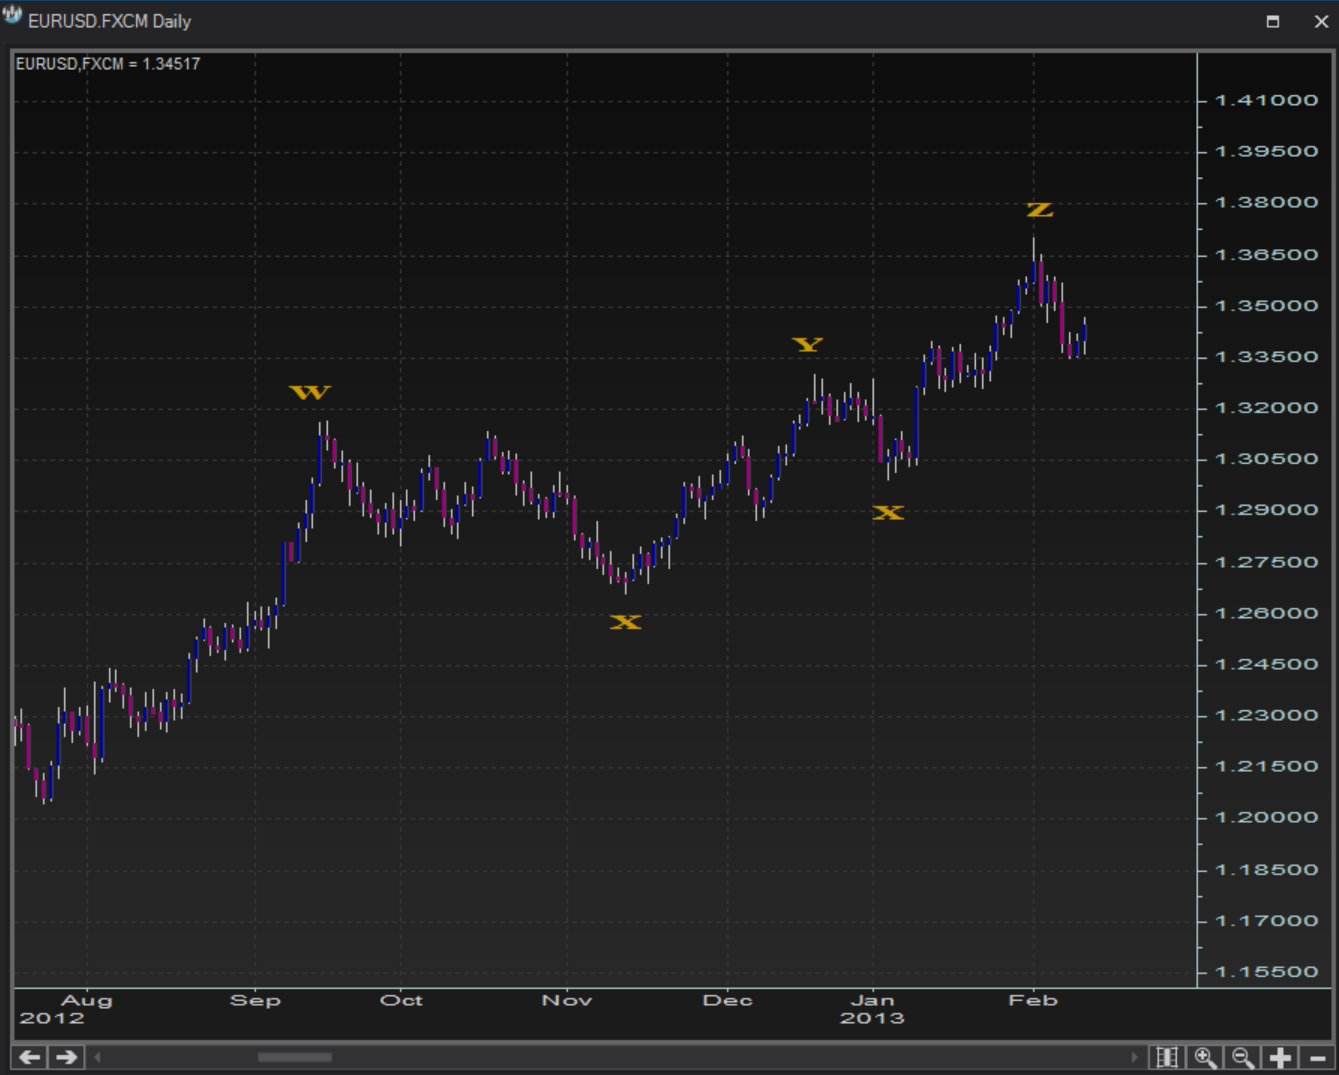
Triple corrective pattern labels (w-x-y-x-z) can be created under the option:
Right click >> Insert chart tools >> Elliott Wave Labels >> Triple Corrective
- Triple corrective patternProperties dialog
Properties dialog Triple corrective pattern
- Triple corrective patternChart plot
Chart plot Triple corrective pattern
Shown below is an example of triple corrective pattern labels drawn on a chart.
Channels
- Raff regression channelsContext menu
Context menu Raff regression channels
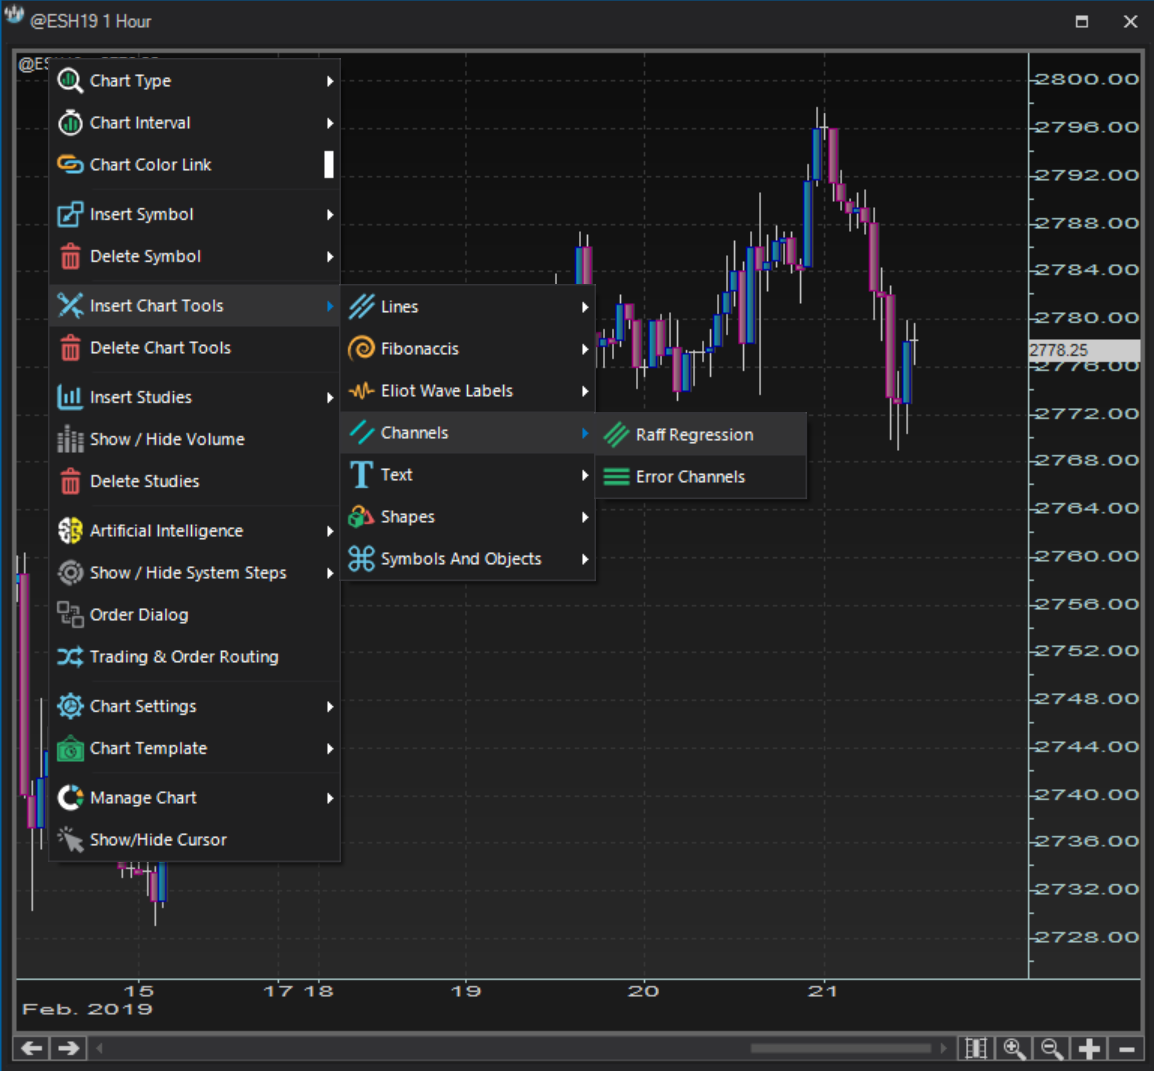
Raff regression channels are available under the option:
Right click >> Insert chart tools >> Channels >> Raff Regression
- Raff regression channelsProperties dialog
Properties dialog Raff regression channels
There is no Raff Regression Properties dialog.
- Raff regression channelsChart plot
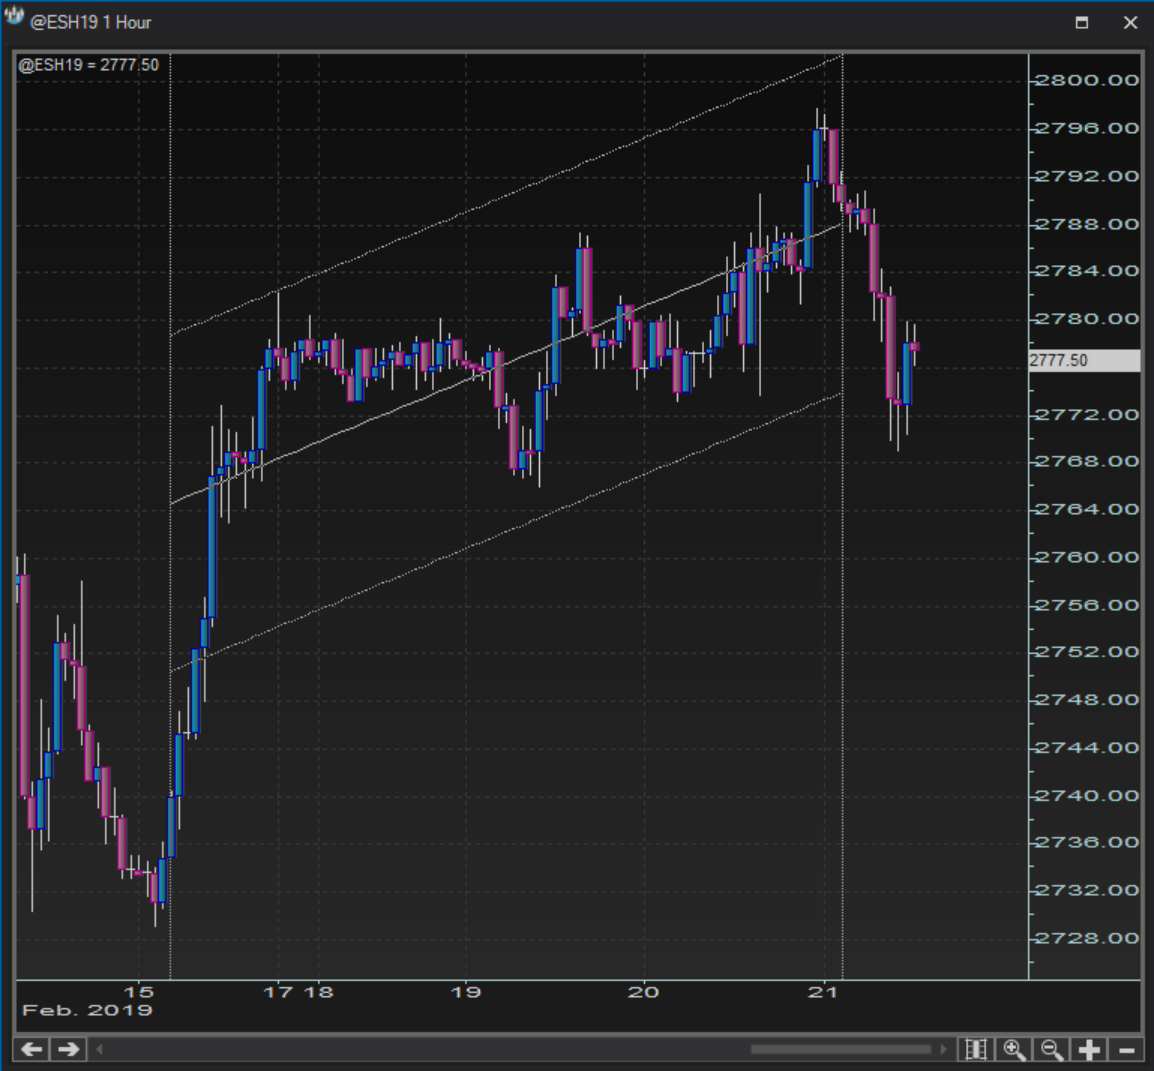
Chart plot Raff regression channels
Shown below is an example of a raff regression channel drawn on a chart.
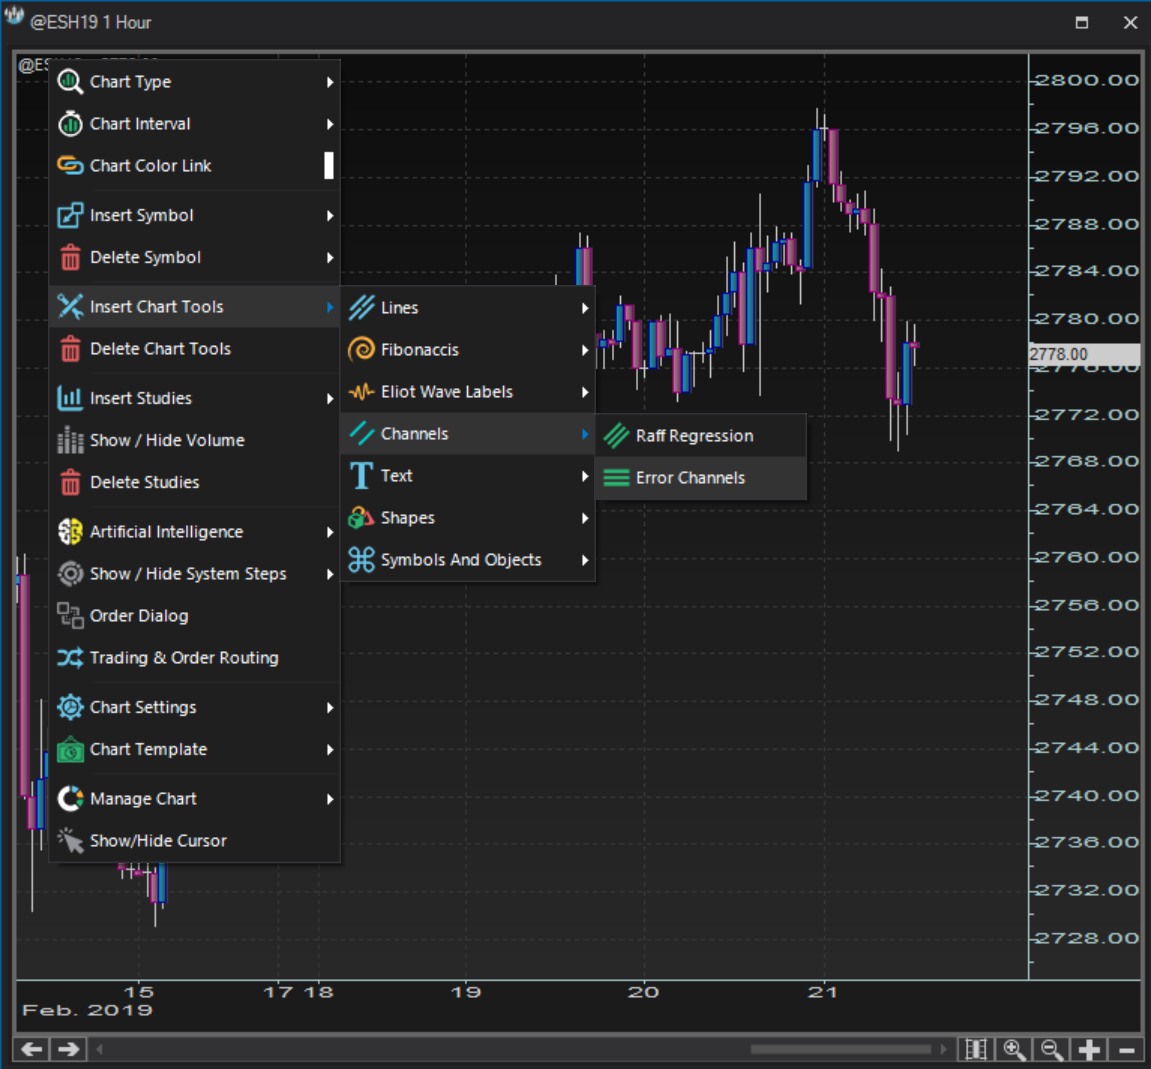
- Error channelsContext menu
Context menu Error channels
Error channels are available under the option:
Right click >> Insert chart tools >> Channels >> Error Channels
- Error channelsProperties dialog
Properties dialog Error channels
There is no Error Channels Properties dialog.
- Error channelsChart plot
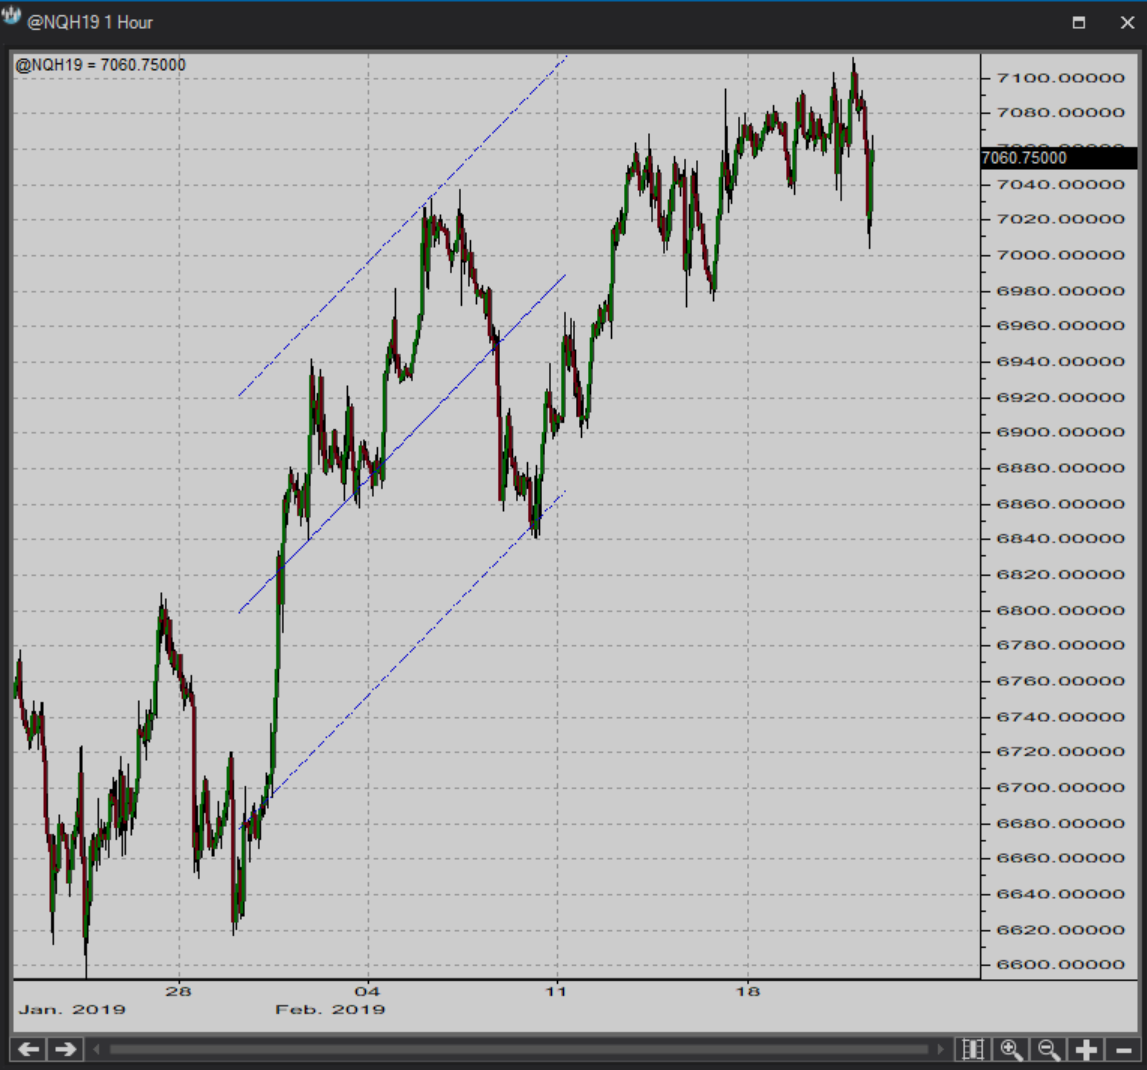
Chart plot Error channels
Shown below is an example of an error channel drawn on a chart.
Text, Shapes and Symbols & Objects tools
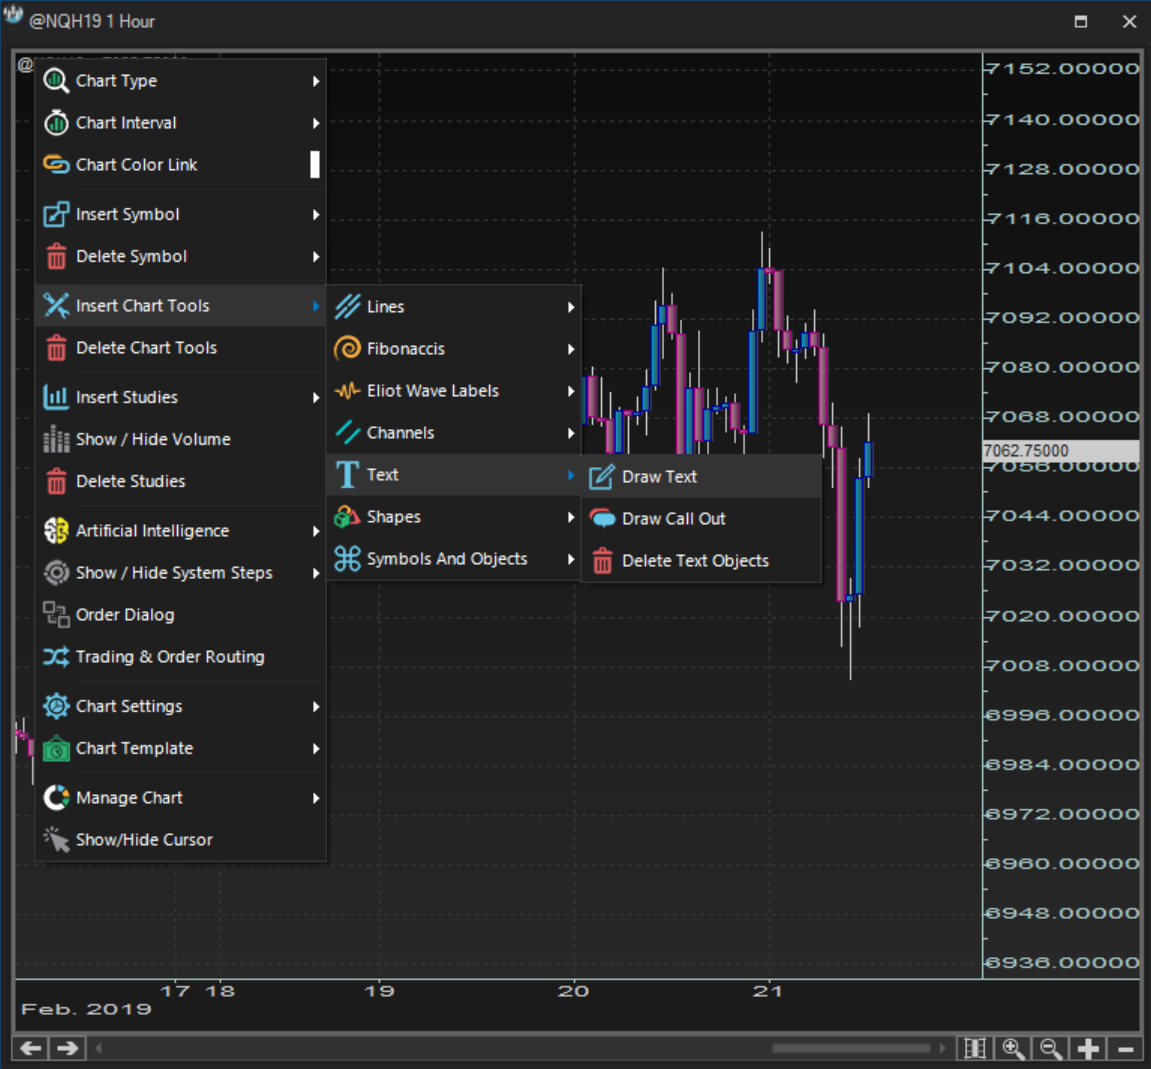
- Text toolContext menu
Context menu Text tool
Text tools are available under the option:
Right click >> Insert chart tools >> Text >> Draw Text
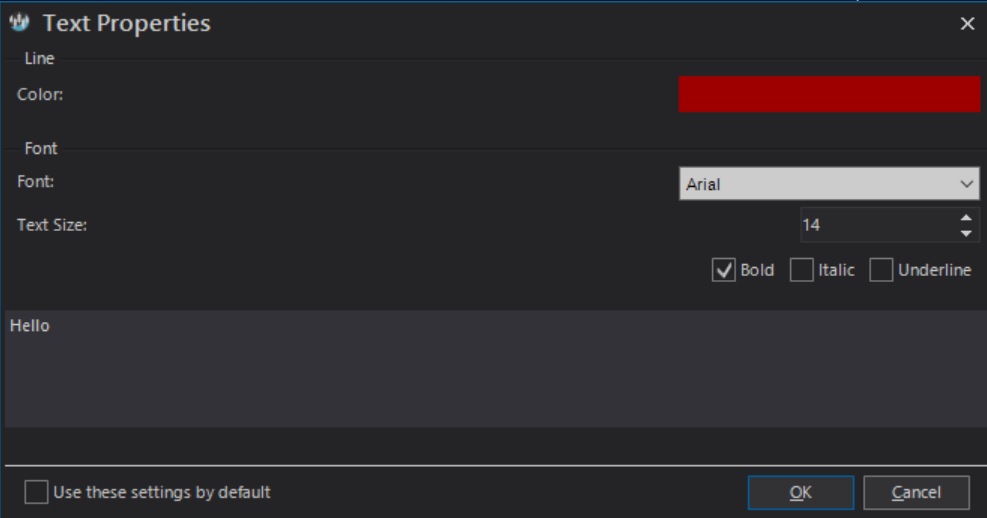
- Text toolProperties dialog
Properties dialog Text tool
The Text Properties dialog allows you to customize the text tool features, including actual text content plus the color, the weight and the style of the fonts.
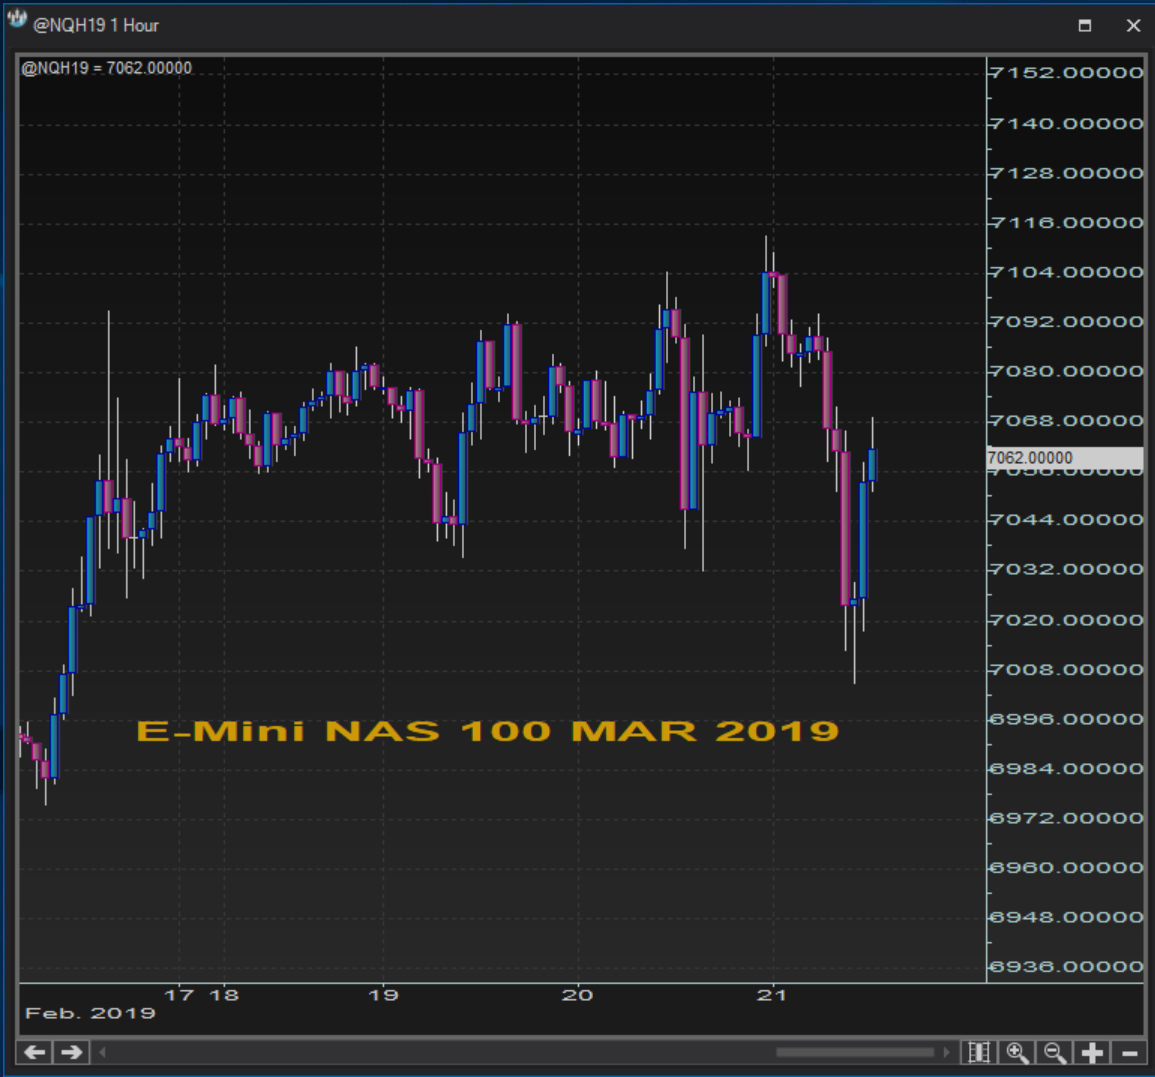
- Text toolChart plot
Chart plot Text tool
Shown below is an example of a text tool drawn on a chart.
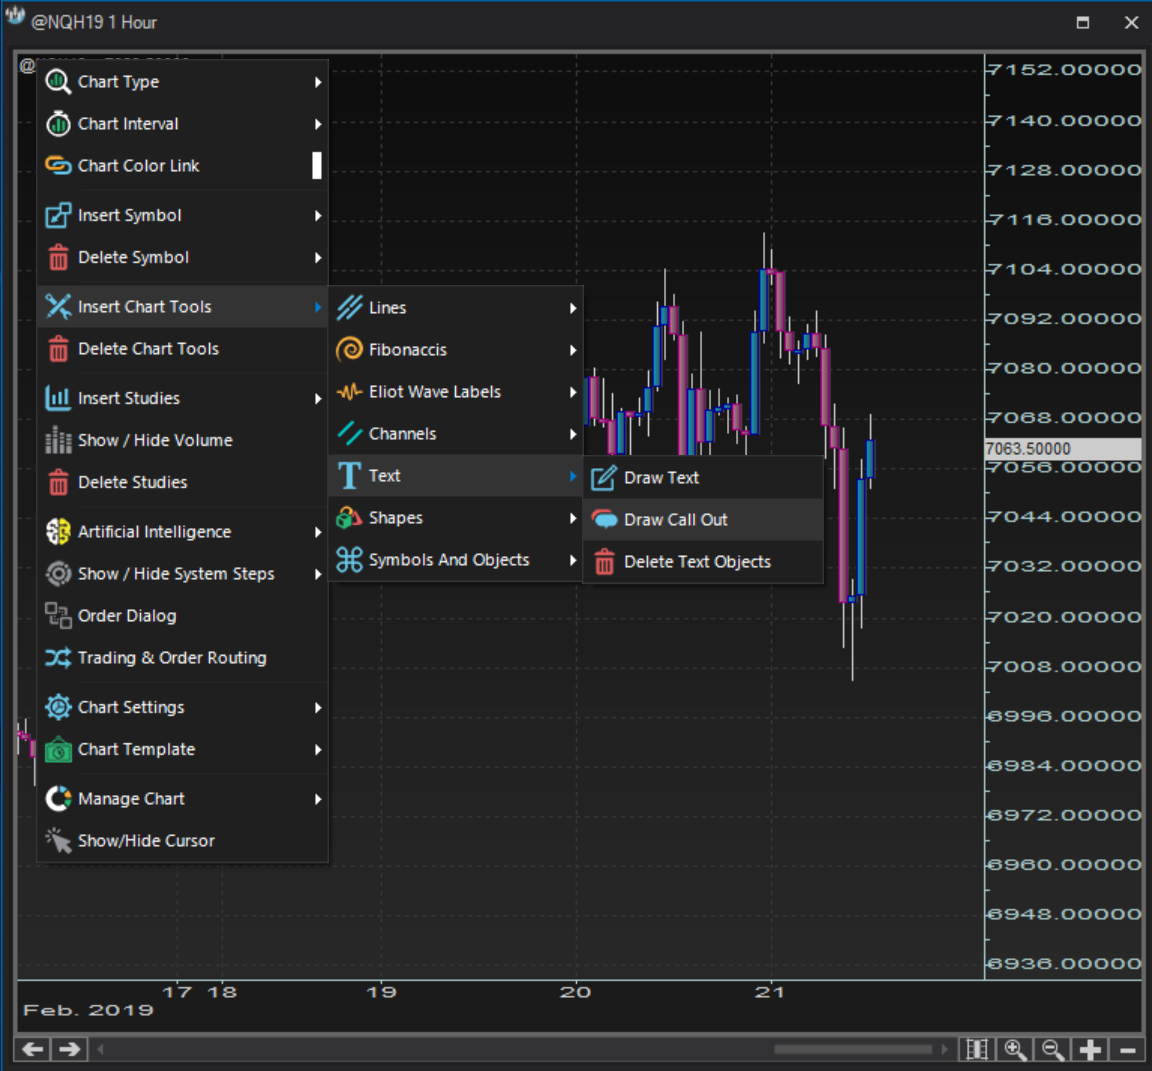
- Callout toolContext menu
Context menu Callout tool
Call out tools are available under the option:
Right click >> Insert chart tools >> Text >> Draw Call Out
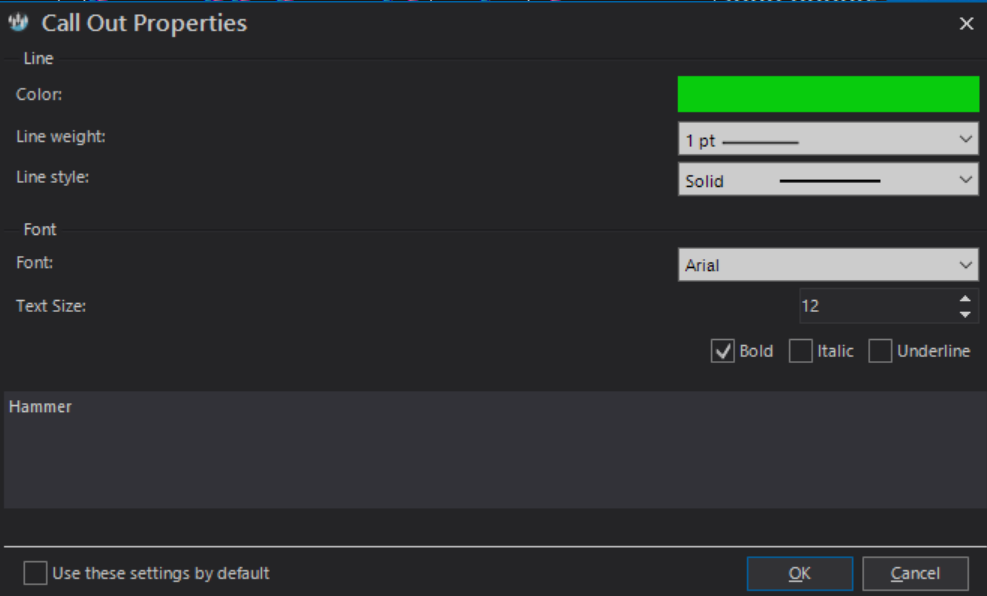
- Callout toolProperties dialog
Properties dialog Callout tool
The Callout Properties dialog allows you to customize the callout tool features, including actual text content plus the color, the weight and the style of the fonts and lines used.
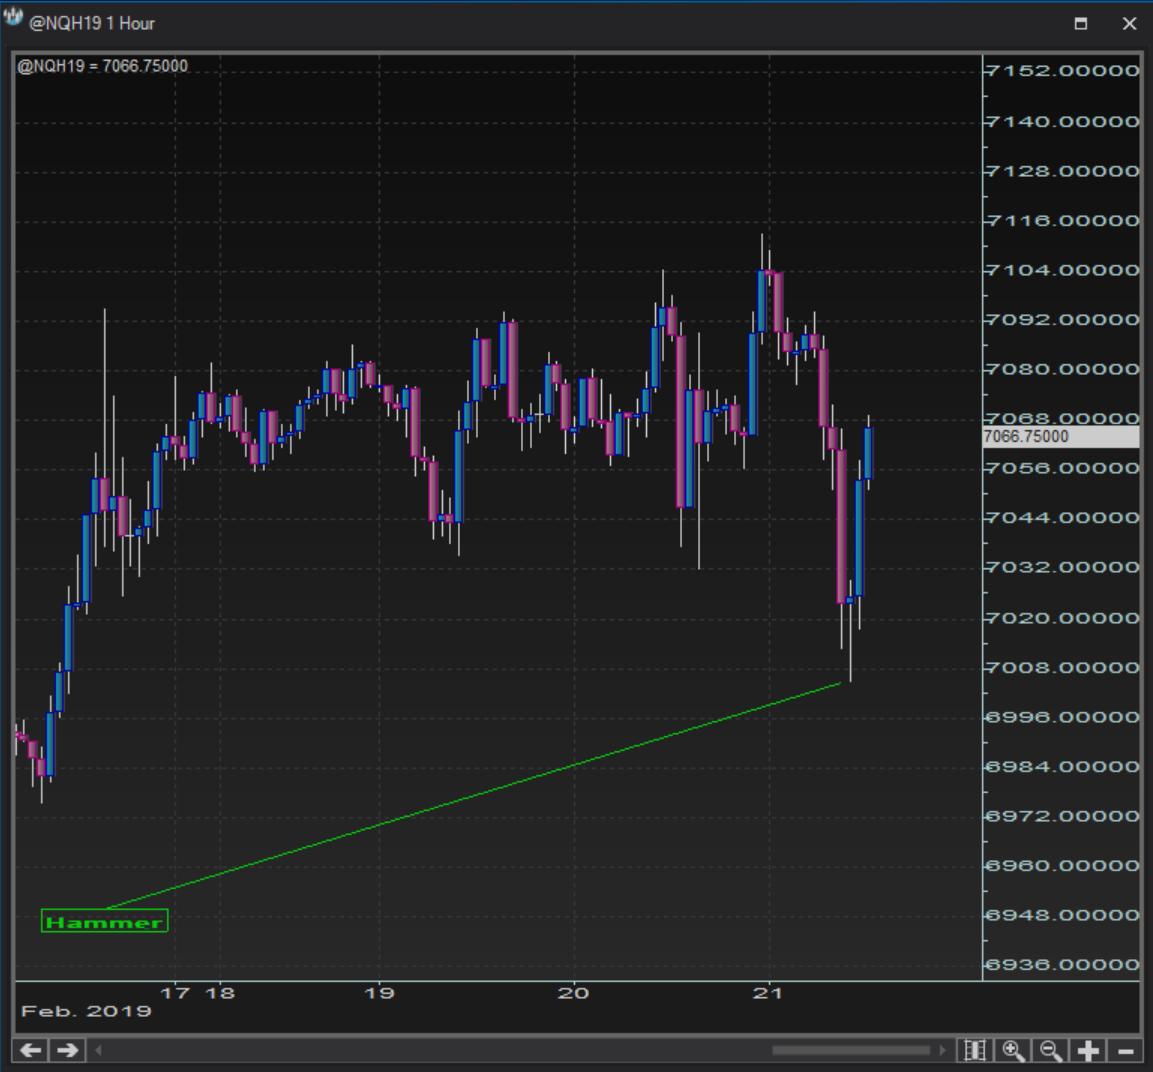
- Callout toolChart plot
Chart plot Callout tool
Shown below is an example of a callout tool drawn on a chart.
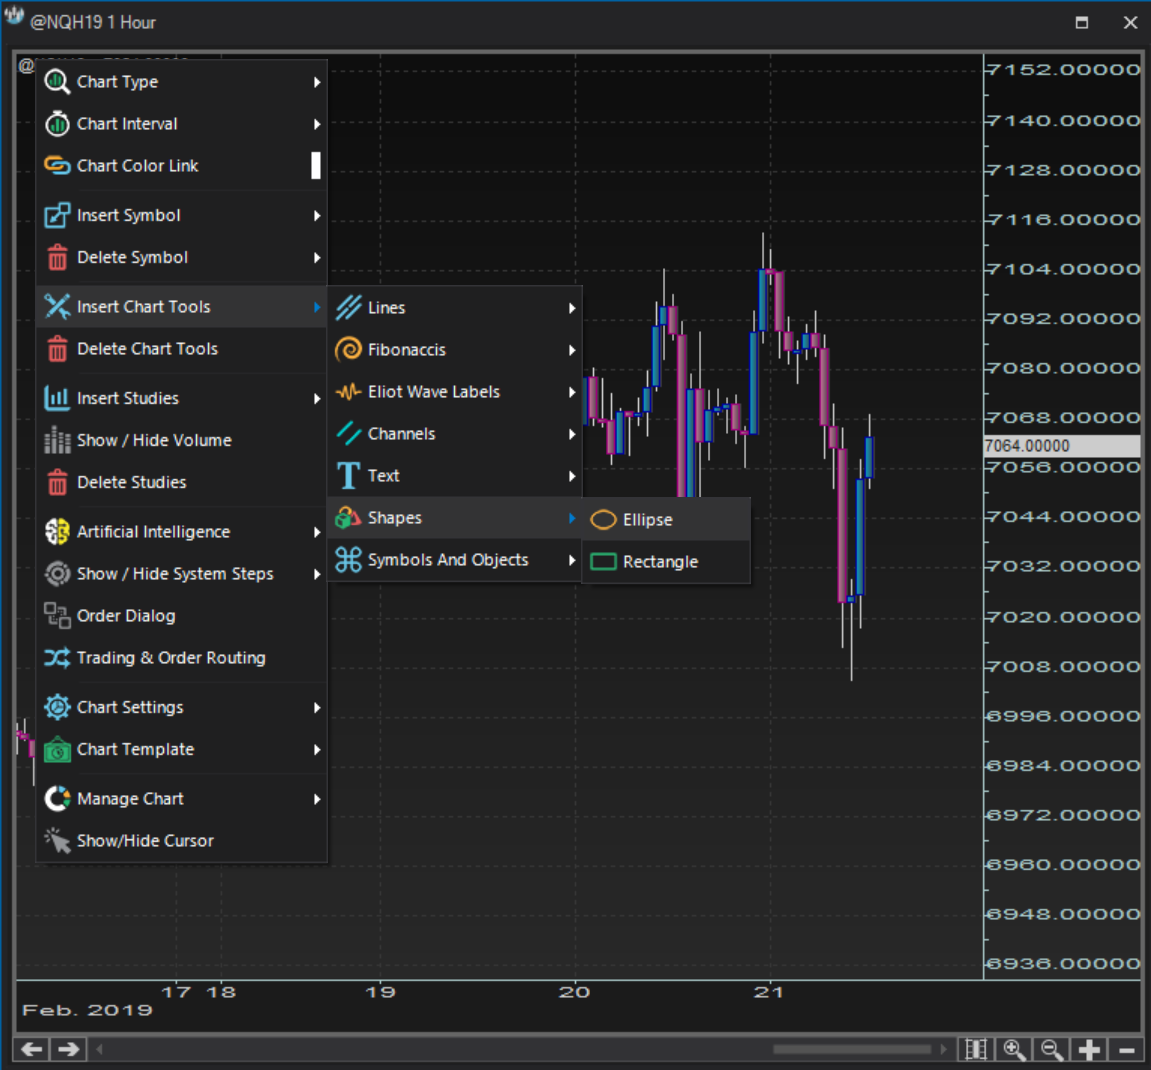
- Ellipse shapeContext menu
Context menu Ellipse shape
Ellipse shapes are available under the option:
Right click >> Insert chart tools >> Shapes >> Ellipse
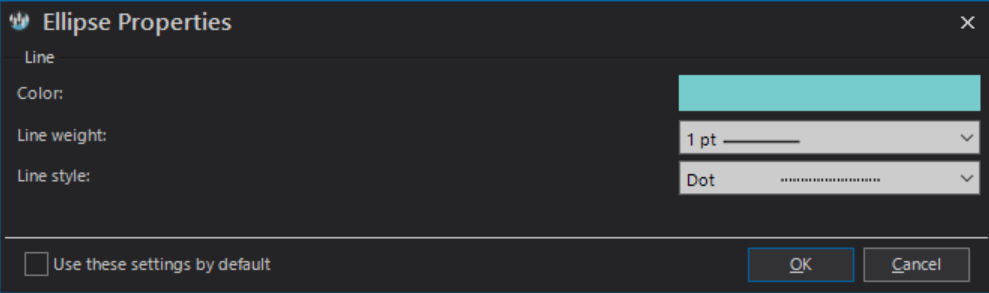
- Ellipse shapeProperties dialog
Properties dialog Ellipse shape
The Ellipse Properties dialog allows you to customize the color, the weight and the style of the ellipse.
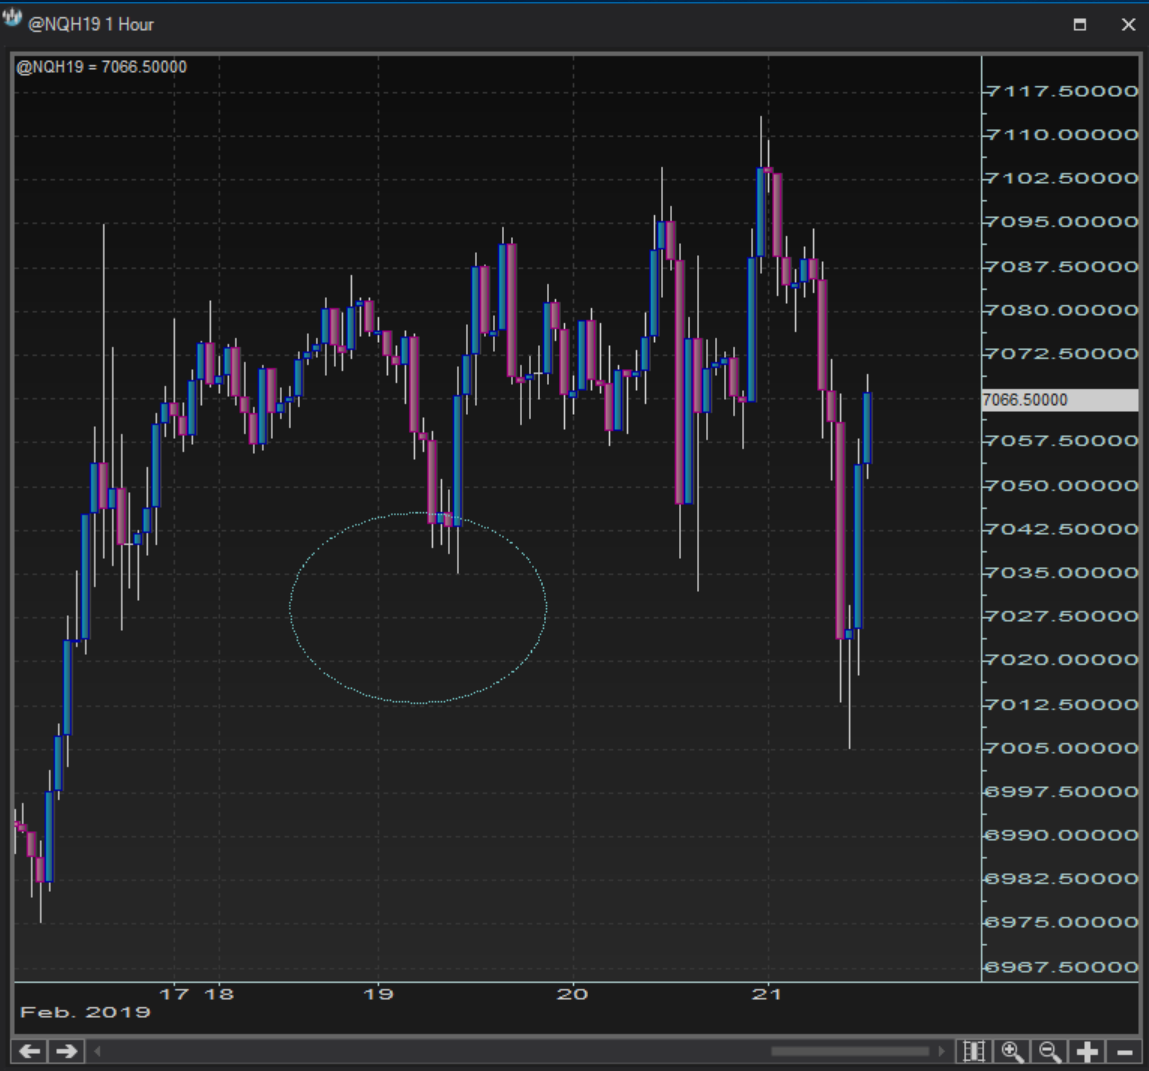
- Ellipse shapeChart plot
Chart plot Ellipse shape
Shown below is an example of an ellipse shape drawn on a chart.
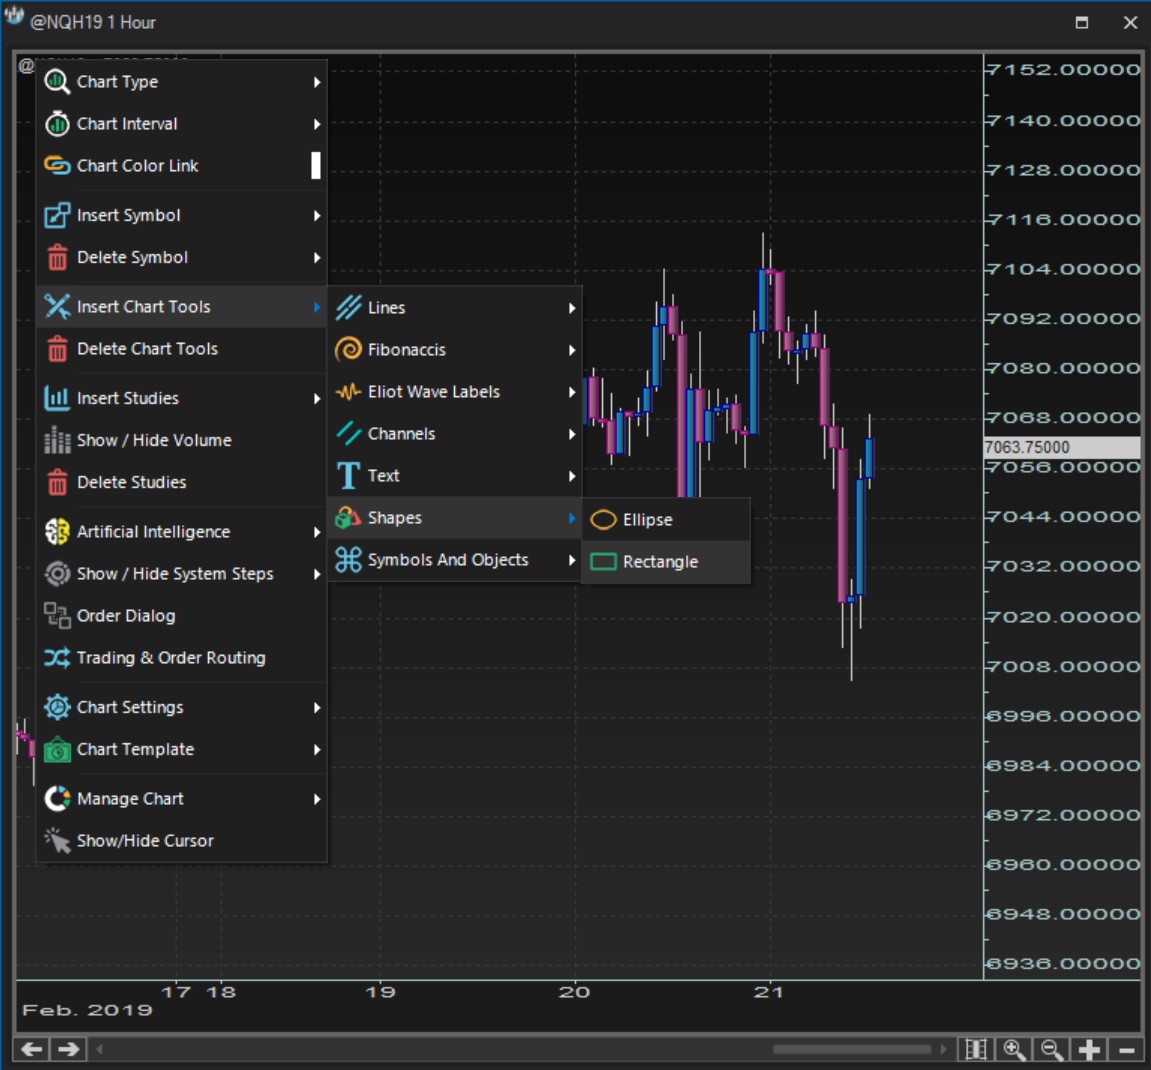
- Rectangle shapeContext menu
Context menu Rectangle shape
Rectangle shapes are available under the option:
Right click >> Insert chart tools >> Shapes >> Rectangle
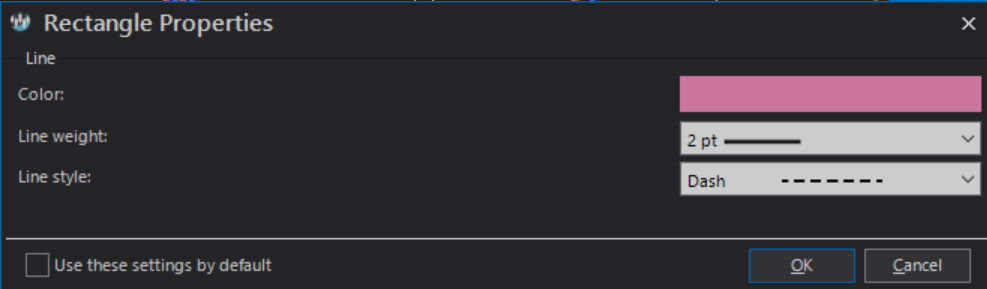
- Rectangle shapeProperties dialog
Properties dialog Rectangle shape
The Rectangle Properties dialog allows you to customize the color, the weight and the style of the rectangle.
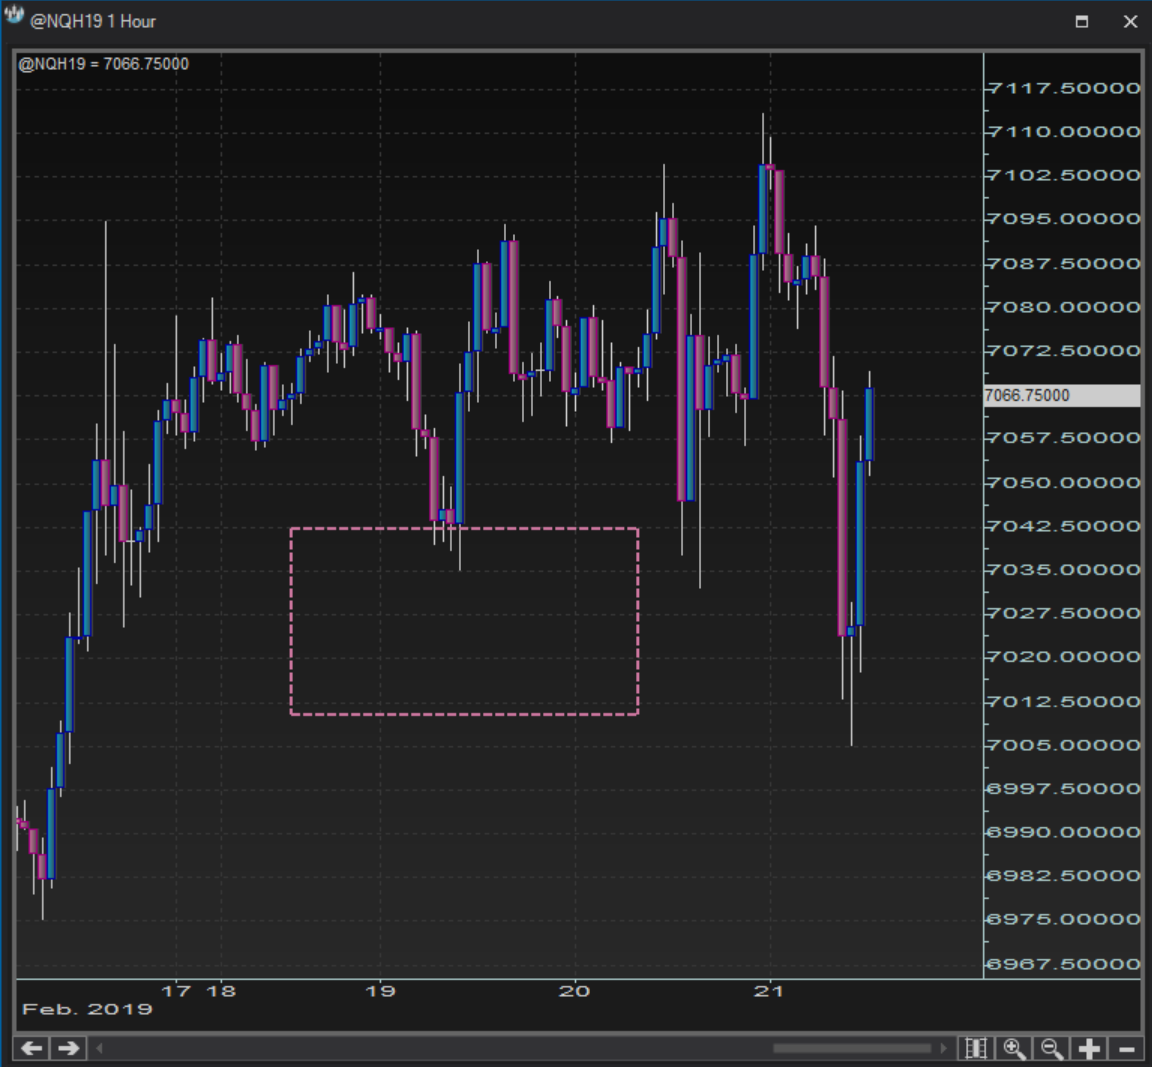
- Rectangle shapeChart plot
Chart plot Rectangle shape
Shown below is an example of a rectangle shape drawn on a chart.
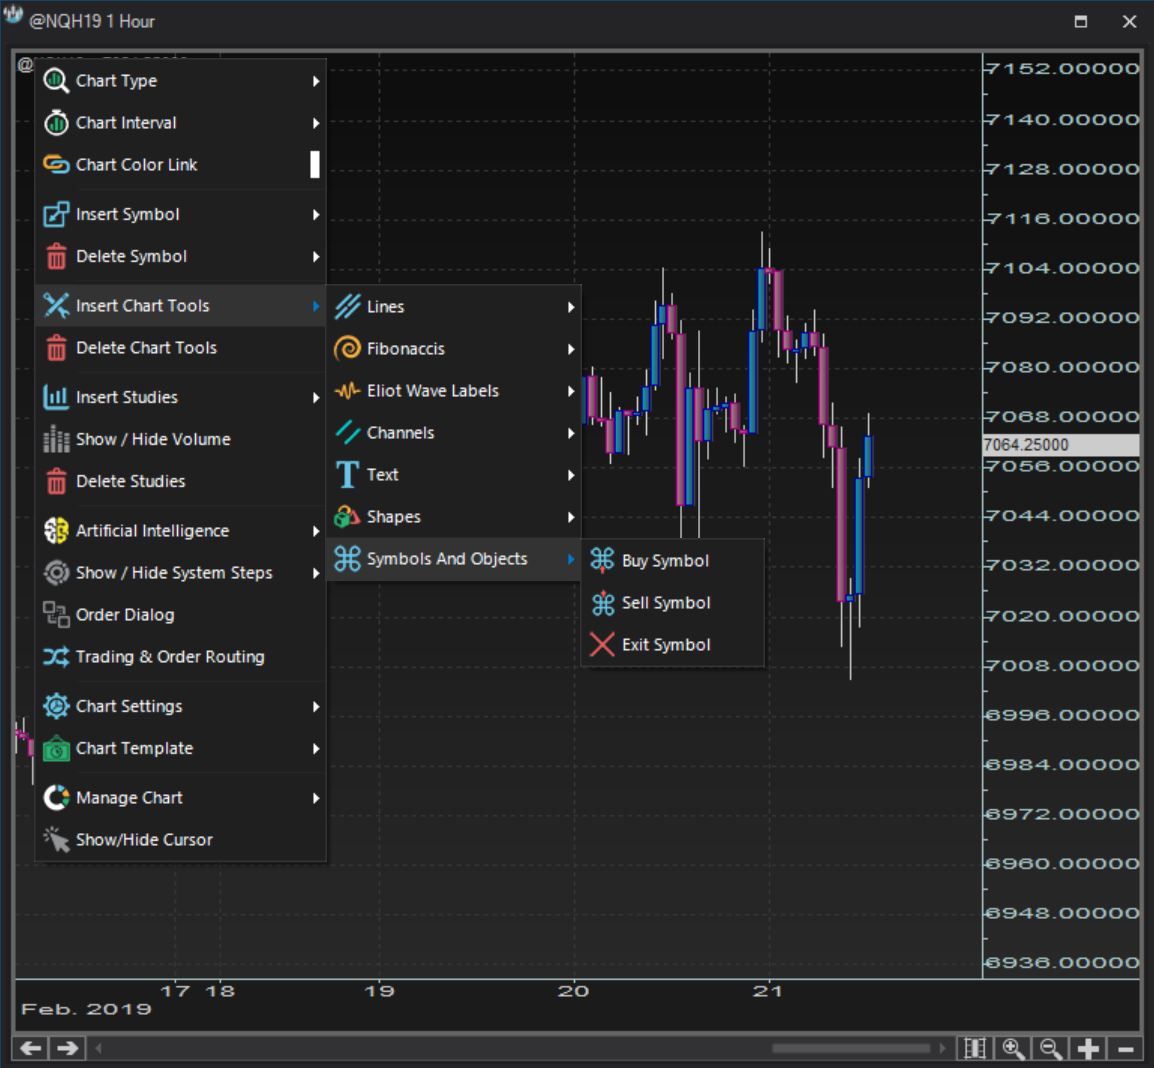
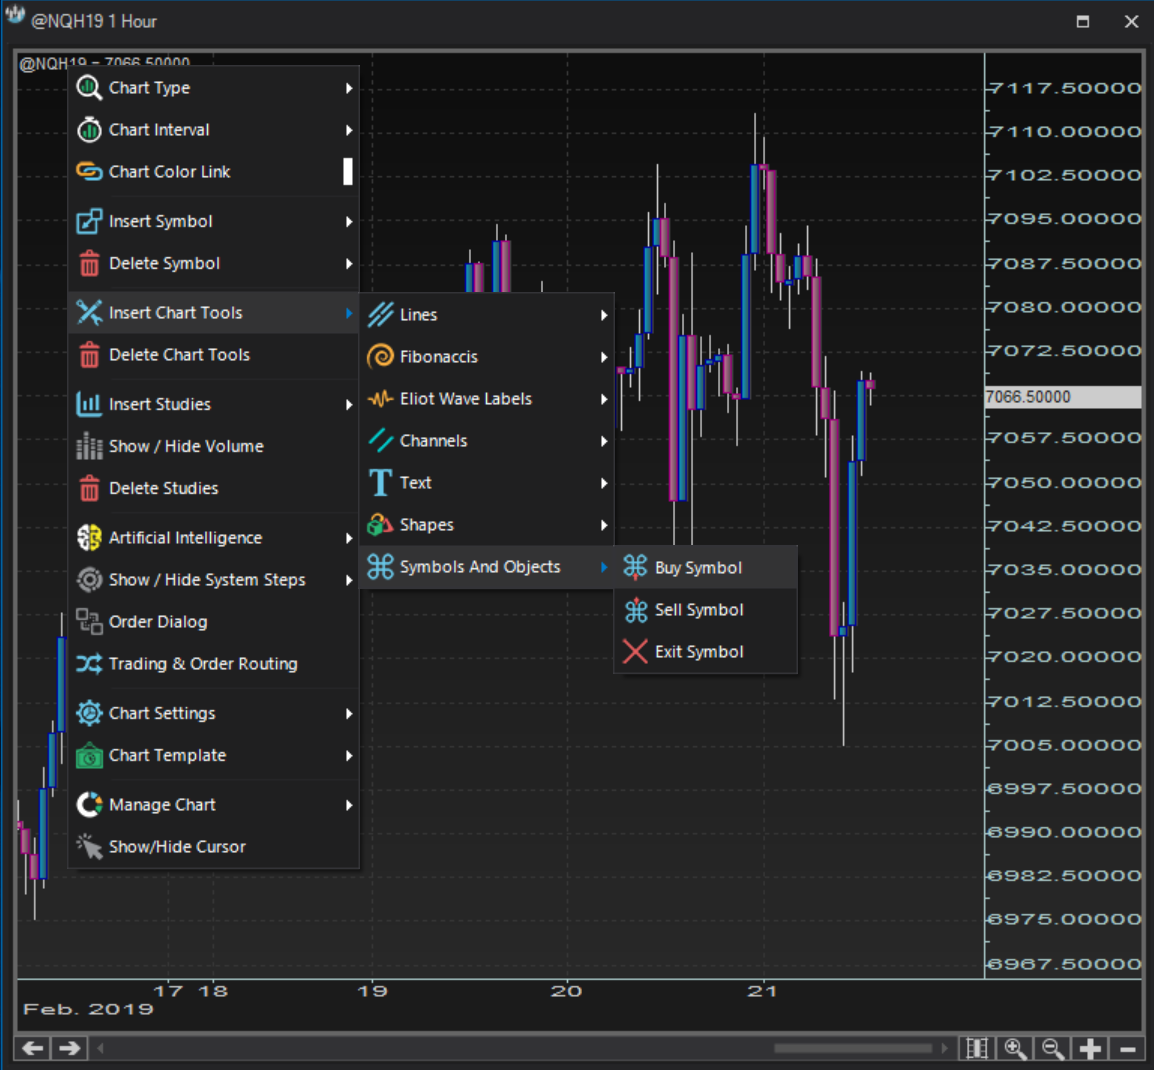
- Symbols & objectsContext menu
Context menu Symbols & objects
Symbol tools are available under the option:
Right click >> Insert chart tools >> Symbols and objects
- Symbols & objectsProperties dialog
Properties dialog Symbols & objects
There is no Symbols and objects Properties dialog.
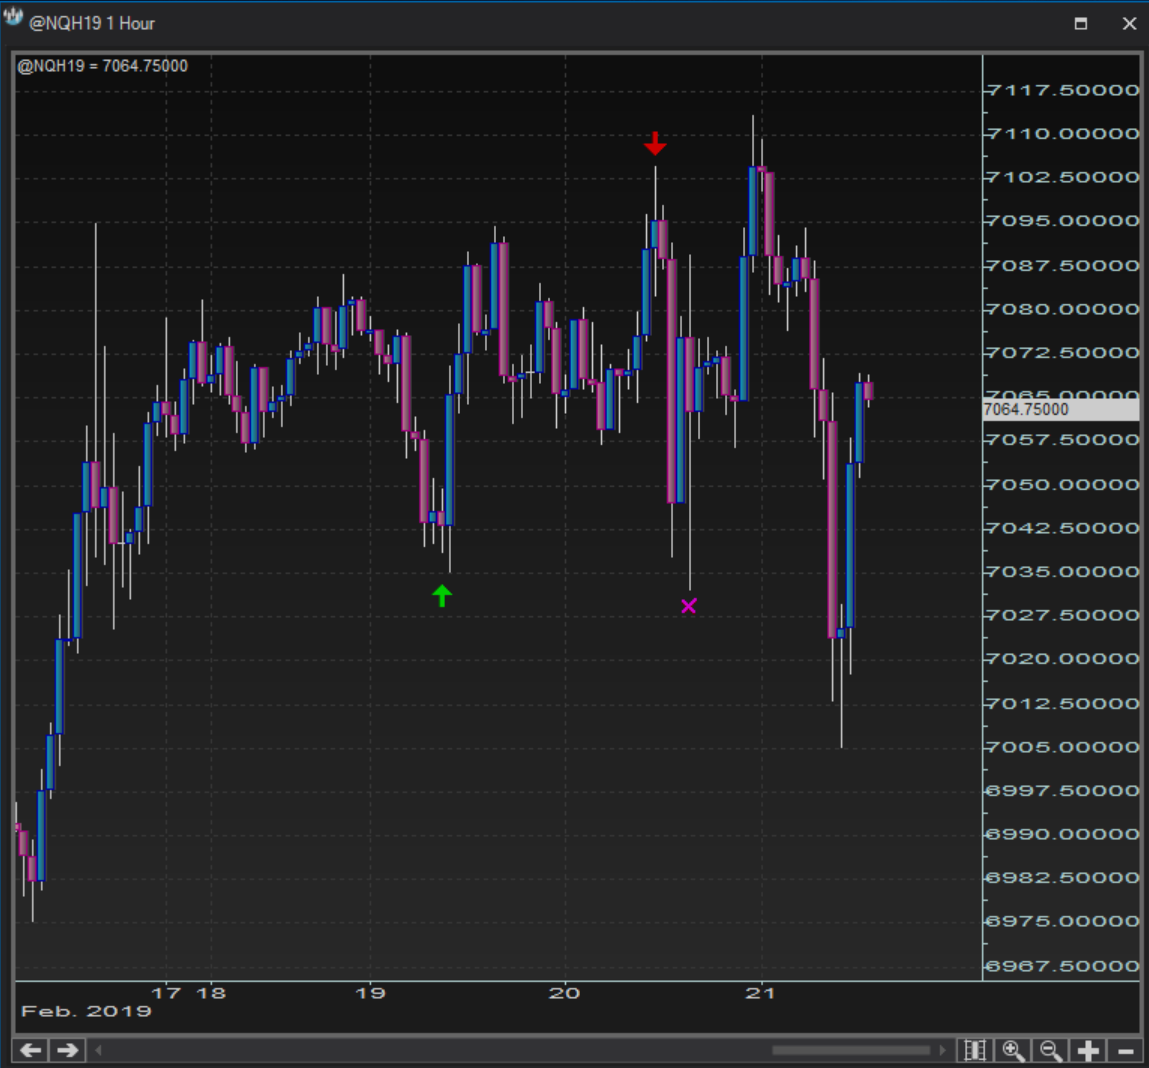
- Symbols & objectsChart plot
Chart plot Symbols & objects
Shown below are some examples of symbols and objects tools drawn on a chart.